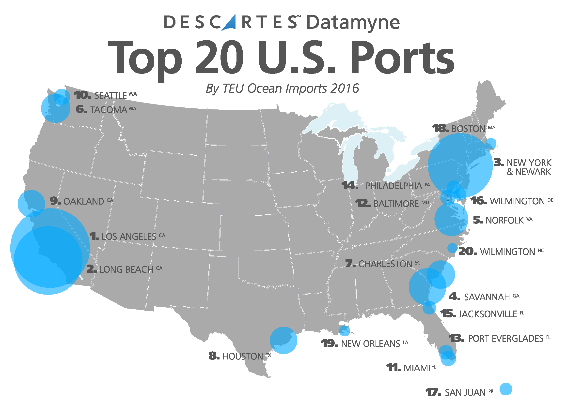
We are pleased to publish Descartes’ Annual U.S. Port Report, covering the top 20 U.S. ocean ports ranked by import Twenty Foot Equivalent Units (TEUs). Findings reveal the top products imported through each port by Harmonized System (HS) code as well as Bill of Lading (BOL) shipment counts and values. The results speak to evolving trends with both coasts posting higher import volume on average, and many locations continuing to enhance infrastructure to accommodate larger vessels.
Download the free PDF of Descartes' Annual Top 20 U.S. Port Report
Take the Pulse of Port Trends with Actionable Data
Monitoring port volume cargo is critical to identify changes in demand, gain insight into competitive activity, and to identify trends at a macro level.
Types of data analyzed in our report include:
- Port location
- Year-over-year comparisons in volume
- Market share trends
- Top importing companies, carriers, and countries of origin
Data Insight from the Top U.S. Ports
In 2017, the top 20 ports handled nearly 98 percent of U.S. import volumes. In the last five years, a number of these ports realized a 30 percent increase in import volume, compared with growth in U.S. imports overall, which has risen more than 18 percent since 2012.
Factors Contributing to Port Volume
Receiving ever larger ocean vessels and delivering into dynamic logistics supply chains, the top U.S. ports have had to adapt to stay competitive and meet increasing volume demands year over year.
- The Panama Canal expansion continues to be a prime driver of infrastructure investment across the U.S. To prepare for the larger “post-Panamax” vessels calling on their docks, ports across the country have launched billions of dollars’ worth of development projects.
Register to download a free PDF copy of Descartes Annual Top 20 U.S. Port Report.
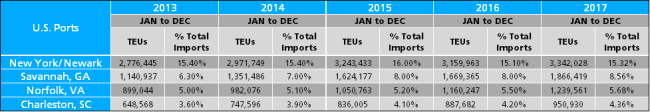
Import TEU Volume and Market Share
Select East Coast ports continue to capture a substantial import market share. In 2012, the Port of New York/Newark accounted for 9.6 percent of U.S. import TEUs. Since then, that share has grown to a steady 15 percent as the port increased its import volumes 86.8 percent over five years, from 1.69 TEUs annually in 2012 to 3.34 million in 2017.
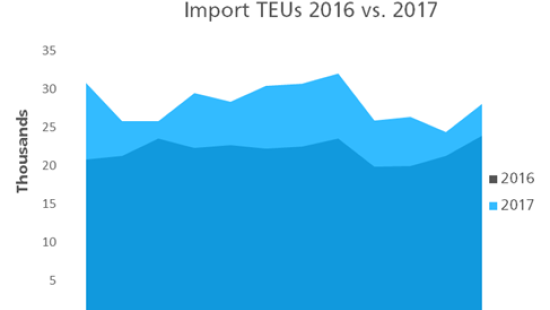
Similarly, the Port of Savannah held a 6.2 percent stake of U.S. imports in 2012. In 2017, the port’s share is over 8.5 percent, based on an increase of nearly 600,000 TEUs for a total of 1.87 million in 2017.
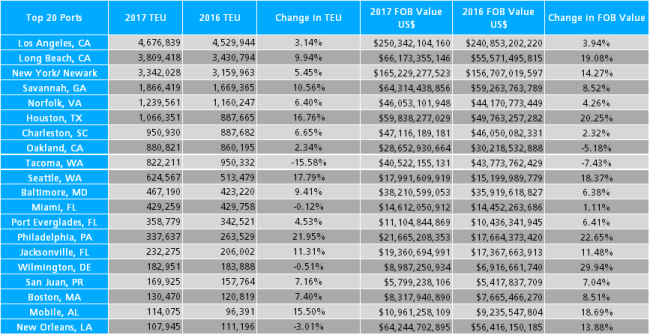
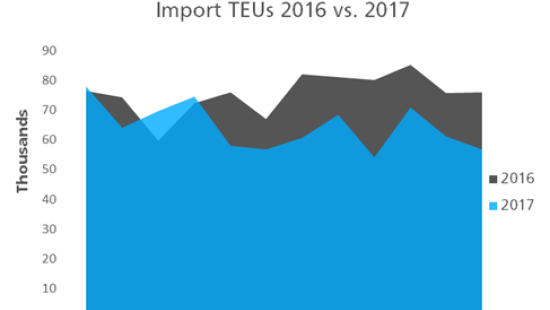
West Coast port volumes are shifting as well. The Port of Los Angeles is still ranked as the top port in the nation in import volume, with 4.68 million TEUs imported in 2017, up 3.9 percent from 2016. However, the port’s 23.2 percent share of U.S. imports in 2012 has further receded to 20.8 percent in 2017.
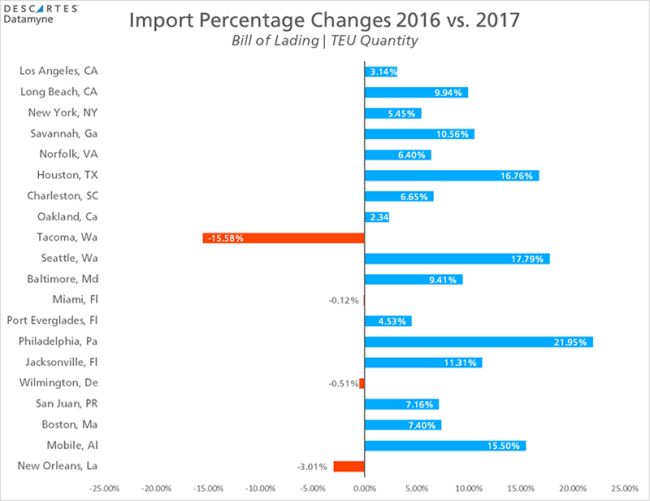
Top 20 U.S. Ports Year-Over-Year Analysis
Comparing year-over-year data, the majority of the top 20 ports displayed steady growth in 2017 with Tacoma, Wilmington, and New Orleans as the only outliers.
The Port of Tacoma
After showing a strong 8.9 percent increase in import volume in 2016, the Port of Tacoma fell 15.9 percent in 2017. This drop is offset by a 17.8 percent increase in volume by its sister port in the Northwest Seaport Alliance, the Port of Seattle. Since merging in 2015, the two ports have collectively seen an increase in volume by 10.9 percent.
The Port of Mobile
A newcomer to the top 20 list, The Port of Mobile saw its import volume increased 15.5 percent as the port completed Phase 2 of its five-part expansion project. The multi-billion-dollar long-term plan is designed to increase the port’s throughput volume to 1.5 million. A $49.5 million expansion was approved in late 2017 with specific plans for a 400 ft. dock extension and Post-Panama crane rails.
The Port of Philadelphia
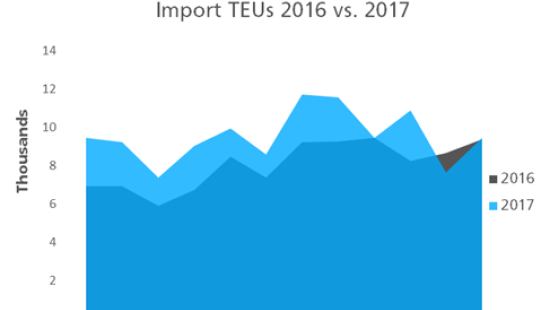
The Port of Philadelphia saw the largest increase in year-over-year import volume among the top U.S. ports. Driven in part by a both $300 million expansion and the completion of the deepening of the Delaware River channel, the import volume into Philadelphia increased 21.9 percent in 2017. The large influx of imports can be also be attributed to new shipping services offered at the port.
How Descartes Can Help
Descartes Datamyne offers a comprehensive database of accurate, up-to-date import-export information to help businesses stay current with port, commodity, import and export trends. Our solution delivers actionable intelligence for market research, sales insight, supply chain management, enhanced security and competitive strategy.
Powered by the world’s largest searchable trade database and covering the global commerce of 230 markets across 5 continents. Descartes Datamyne provides access to market data faster than any other source in the industry. U.S. maritime import data is refreshed daily with information sourced directly from Customs authorities 24-hours after shipment arrival; monthly for international data sources.
Register to download a free PDF copy of Descartes' Annual Top 20 U.S. Port Report.