The Global Shipping Report
November U.S. Container Imports Dip Amid Seasonal Slowdown and Weakening China Imports
Stay informed with the latest insights from the Descartes Global Shipping Report
Data for the Global Shipping Report provided by Descartes Datamyne
In November 2025, U.S. container imports totaled 2,183,048 twenty-foot equivalent units (TEUs), declining 5.4% from October in line with the typical month-over-month seasonal drop, November’s shorter month and Thanksgiving-related slowdowns. With a sharp 11.3% decline, China-origin imports were a major driver of November’s overall volume pullback, occurring against a backdrop of ongoing U.S.–China policy adjustments. Port transit delays also edged higher in November, reflecting the seasonal slowdown but not signaling any systemic congestion. Heading into year-end, the legal challenge to Liberation Day tariffs and continued carrier caution in the Red Sea corridor are additional factors contributing to a cautious but steady outlook for U.S. importers.
In this Article...
- toc
U.S. container imports post seasonal decline in November.
In November 2025, U.S. container import volumes totaled 2,183,048 TEUs, down 7.8% year-over-year (see Figure 1). Year-to-date volumes are now just 0.1% higher than the same period in 2024, with the growth margin shrinking from nearly 10% in January to near zero by November. This convergence points to the effects of suspected early-year frontloading, a cooling economic backdrop, and softer consumer demand that has gradually pulled 2025 volumes closer to 2024.
Figure 1: U.S. Container Import Volume Year-over-Year Comparison
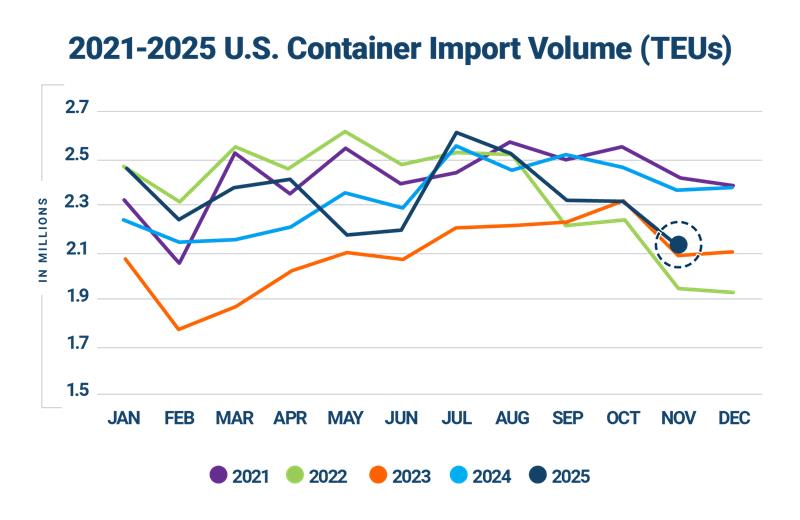
Source: Descartes Datamyne™
November 2025 import volumes declined 5.4% from October (123,639 TEUs) (see Figure 2), consistent with the typical month-over-month decrease observed in each of the past ten years. In addition to being a shorter 30-day month, November operations were further constrained by the U.S. Thanksgiving holiday. Beyond seasonal factors, this year’s decline may also reflect importer caution amid a dynamic tariff backdrop. November 2025 still, however, ranks as the fourth-strongest November on record, trailing only 2020, 2021, and 2024—underscoring the underlying resilience of U.S. import demand despite policy and economic uncertainty.
Figure 2: October to November U.S. Container Import Volume Comparison

Source: Descartes Datamyne™
Top 10 U.S. port volumes decline in November compared to October.
Following October’s relatively steady performance, November 2025 container volumes across the top 10 U.S. ports fell by 106,401 TEUs, a 5.4% month-over-month decrease (see Figure 3). Among individual ports, declines were widespread. Los Angeles posted the largest drop at 9.6% (41,434 TEUs), followed by Long Beach at 7.9% (33,089 TEUs) and Houston at 10.0% (16,123 TEUs). Oakland also saw a notable decrease of 11.5% (8,960 TEUs), while Charleston (7.0%), Tacoma (4.0%), New York/Newark (4.4%), Norfolk (1.2%), and Savannah (0.4%) all posted smaller pullbacks. The only major gateway to record growth was New York, NY, which jumped 64.1% (19,880 TEUs). These results reflect the typical seasonal slowdown, with reduced inbound volumes in line with the declines normally observed at this time of year.
Figure 3: October 2025 to November 2025 Comparison of Import Volumes at Top 10 U.S. Ports

Source: Descartes Datamyne™
China-origin import volumes decline in November.
U.S. containerized imports from China fell to 713,131 TEUs in November 2025, down 11.3% month-over-month, 19.7% year-over-year, and 30.3% below the record July 2024 level of 1,022,913 TEUs (see Figure 4). China’s share of total U.S. imports eased to 32.7% in November, down from 34.9% in October.
Year-over-year declines were broad across China’s leading import categories in November, with most major goods posting double-digit reductions. Furniture and bedding (HS-94), China’s largest category, fell 18.8% year-over-year to a 16.5% share of China-origin imports, a shift that may also reflect importer adjustments following the mid-October implementation of new U.S. tariffs on certain furniture products. Toys and sporting goods (HS-95) declined 23.5%, while electrical machinery (HS-85) and machinery (HS-84) fell 24.3% and 23.6%, respectively. Apparel categories also continued to weaken sharply, with knit apparel (HS-61) down 30.1% and non-knit apparel (HS-62) down 18.7%.
In contrast, plastics (HS-39) remained comparatively steady, posting a slight 0.1% year-over-year increase and rising to 15.1% of total China-origin imports. Several other categories saw substantial year-over-year pullbacks, including iron and steel articles (HS-73, 27.3%), vehicles (HS-87, 21.8%), paper (HS-48, 31.5%), footwear (HS-64, 36.2%), and rubber products (HS-40, 38.8%).
Figure 4: November 2024–November 2025 Comparison of U.S. Total and Chinese TEU Container Volume Relative to Chinese Import Record

Source: Descartes Datamyne
China-origin imports decline across key U.S. ports in November.
In November 2025, China-origin imports across the top 10 U.S. ports fell by 95,409 TEUs, a 12.5% month-over-month decrease (see Figure 5). The decline was broad-based, with most major gateways posting double-digit pullbacks. Long Beach dropped 11.2% (26,731 TEUs) and Los Angeles fell 13.8% (27,058 TEUs), while New York/Newark decreased 13.6% (13,457 TEUs). Additional declines occurred at Houston (18.8%), Oakland (20.1%), Charleston (15.8%), Norfolk (15.0%), Tacoma (8.4%), and Savannah (6.3%). The only major port to post growth was Seattle, which increased 11.2% (1,224 TEUs). Overall, the widespread downturn reflects a sharp pullback in China-origin trade flows in November.
Figure 5: October 2025 to November 2025 Comparison of top U.S. Ports for Imports Originating from China

Source: Descartes Datamyne
Top CoO volumes contract in November amid sharp pullback from China.
In November 2025, U.S. containerized imports from the top 10 CoO fell 6.7% month-over-month—a combined decrease of 110,410 TEUs (see Figure 6). The decline was led by China, which dropped 90,770 TEUs (11.3%), significantly outweighing movements in other countries. Additional decreases were recorded from South Korea (12.8%), Hong Kong (6.8%), Indonesia (7.0%), India (5.9%), Japan (8.4%), and Vietnam (0.6%). In contrast, a few countries posted modest gains. Thailand increased 6.7% (6,838 TEUs), Germany rose 9.7% (5,150 TEUs), and Italy edged up 1.4% (752 TEUs). Despite these improvements, the broad pullback across major origins was driven by China’s downturn.
Figure 6: October 2025 to November 2025 Comparison of U.S. Import Volumes from Top 10 Countries of Origin

Source: Descartes Datamyne
YoY import declines among the top 10 CoO concentrated in key Asian countries.
In November 2025, U.S. containerized imports from the top 10 CoO fell 9.3% year-over-year, with a combined loss of 156,831 TEUs (see Figure 7). The decline was led by China, which dropped 174,650 TEUs (19.7%), accounting for the majority of the overall contraction. Additional year-over-year decreases were recorded from India (18.9%), South Korea (16.3%), Japan (8.9%), Germany (5.2%), Italy (5.6%), and Hong Kong (1.9%). In contrast, several Southeast Asian countries posted strong year-over-year growth. Vietnam increased 15.4% (34,892 TEUs), Thailand surged 27.2% (23,159 TEUs), and Indonesia rose 18.0% (8,640 TEUs). Despite these gains, November’s results reflect year-over-year weakness across most major sourcing countries, driven primarily by China’s contraction, even as expanding trade from select Southeast Asian origins offset broader declines.
Figure 7: November 2024 to November 2025 Comparison of U.S. Import Volumes from Top 10 Countries of Origin

Source: Descartes Datamyne™
West Coast ports down slightly but continue to lead; East and Gulf ports inch higher.
In November 2025, port shares shifted modestly from October (see Figure 8). West Coast ports remained the largest share of U.S. containerized imports at 42.6% (down from 44.2%), continuing the lead they have held since June, while East and Gulf Coast ports accounted for 41.1% of total volumes (up from 40.7%). The top 10 ports handled 83.8% of total U.S. containerized imports, slightly below October’s 84.9% but matching their share in November 2024. Overall, coast-to-coast shares remain within the typical range observed throughout the year, underscoring a stable national distribution of import flows.
Figure 8: Volume Analysis for Top Ports, West Coast Ports and East and Gulf Coast Ports

Source: Descartes Datamyne™
Port delays rise slightly in November.
In November 2025, port transit time delays increased marginally across most major U.S. gateways compared to October (see Figure 9). On the West Coast, delays rose at Long Beach (up 0.4 days), Oakland (up 0.1 days), and Seattle (up 0.5 days). Tacoma posted the largest improvement, decreasing 1.5 days, while Los Angeles saw delays fall 1.1 days. On the East and Gulf Coasts, delays increased at New York/New Jersey (0.8 days), Savannah (0.7 days), Charleston (1.3 days), Norfolk (1.1 days), and Houston (0.3 days).
Overall, major U.S. ports continued to process throughput efficiently, with no indication of broad systemic congestion.
Figure 9: Monthly Average Transit Delays (in days) for the Top 10 Ports (Sep. 2025 – Nov. 2025)

Source: Descartes Datamyne™
Note: Descartes’ definition of port transit delay is the difference as measured in days between the Estimated Arrival Date, which is initially declared on the bill of lading, and the date when Descartes receives the U.S. Customs and Border Protection (CBP) processed bill of lading data.
Trusted by
Stay informed with monthly shipping insights with the Global Shipping Report

Director, Industry Strategy, Global Trade Intelligence, Descartes

Gulf Coast import activity softens, sliding below 12-month average.
In November 2025, Gulf Coast container imports declined to 199,796 TEUs, down 10.4% from October’s 222,931 TEUs (see Figure 10). The drop follows October’s short-lived rebound and marks a return to downward momentum after two prior months of decline. November volumes were 10.7% below the rolling 12-month average of 223,822 TEUs, indicating softer activity relative to this year’s levels.
Figure 10: December 2024 to November 2025 U.S. Gulf Coast Container Imports

Source: Descartes Datamyne™
U.S.–China agreements ease short-term pressure but leave core issues unresolved.
The U.S. has extended a large set of Section 301 tariff exclusions through November 2026 and postponed the implementation of additional electronics-related tariffs, providing continued relief for manufacturers and technology importers. China, meanwhile, has temporarily eased aspects of its recent export controls on critical minerals by streamlining licensing for key materials. While these moves contribute to short-term stability, the broader Section 301 tariff structure—along with ongoing disputes over technology, subsidies, and market access—remains firmly in place. As a result, the near-term outlook has improved, but longer-term uncertainty in the U.S.–China trade relationship continues.
Liberation Day tariff enforcement continues amid legal challenge.
Liberation Day tariffs remain in force, although oral arguments in front of the U.S. Supreme Court over their legality as imposed under the International Emergency Economic Powers Act (IEEPA) began on November 5. Until the Supreme Court renders a decision, or another legal resolution is reached, importers continue to operate under uncertainty.
U.S. rolls back tariffs on select food imports.
In November 2025, the U.S. implemented targeted tariff reductions on several food categories, including beef, coffee, fruits, and spices, lowering duty rates for a range of consumer and agricultural products. While limited in scope, these adjustments modestly reduce import costs for affected commodities and may help ease pressure on food-related supply chains.
Red Sea rerouting uncertain as carriers await stronger safety assurances.
While recent reports indicate that Maersk plans to resume Red Sea transits “as soon as conditions allow” following improved security, most container shipping lines remain wary. According to a recent update from the risk monitoring group Xeneta, an immediate large-scale return to Red Sea routing remains unlikely as carriers and insurers continue to demand stronger assurances before reversing detours that route cargo around Africa’s Cape of Good Hope. As of now, the majority of container services continue to avoid the Suez corridor, meaning rerouting, extended transit times, elevated insurance and freight costs, and logistical unpredictability continue to be the working norm.
Government shutdown ends.
The 2025 U.S. federal government shutdown ended on November 12, 2025. During the shutdown, U.S. Customs and Border Protection (CBP) maintained port operations and cargo processing, while several regulatory agencies, including the Food and Drug Administration (FDA) and the U.S. Department of Agriculture (USDA) operated at reduced capacity, delaying some inspections and licensing functions. Although trade logistics consultants warned of possible delays for regulated imports requiring Partner Government Agencies (PGAs) clearance, as of December 2025 there is no published data showing a measurable nationwide slowdown in container throughput or a quantifiable increase in clearance times across all regulated categories.
Managing supply chain risk: what to watch in 2026.
In November 2025, U.S. container imports declined to 2.18M TEUs, reflecting the expected seasonal slowdown driven by November’s shorter month, Thanksgiving-related disruptions, and softer late-year demand. China-origin volumes fell 11.3% month-over-month and 19.7% year-over-year. The recently extended Section 301 exclusions and delayed electronics-related tariffs offer near-term relief, but long-term uncertainty remains as broader structural disputes persist between China and the U.S. At the same time, Liberation Day tariffs remain in force pending a Supreme Court ruling, while a small set of food-related tariff reductions introduced in November provided limited targeted relief for importers. Globally, Red Sea security risks continue to keep most carriers rerouted around the Cape of Good Hope, sustaining longer transit times and elevated costs. Taken together, these factors shape a cautious trade environment heading into early 2026. Here’s what Descartes is monitoring in the months ahead:
- Expanded tariffs and other potential ‘protectionist’ trade policies. Broader and deeper tariffs applied to a wide array of goods could compel U.S. importers to significantly re-engineer their supply chains, putting additional pressure on global logistics infrastructure. With China-origin imports down 11.3% in November, importers remain focused on evolving tariff policy. Recent U.S.–China actions, including extended Section 301 exclusions and delayed new electronics-related tariffs, offer near-term relief, but long-term uncertainty persists around technology, subsidies, and market access. The U.S. also rolled back tariffs on select food imports in November—including beef, coffee, fruits, and spices—providing modest cost relief for affected commodities. Liberation Day tariffs also remain in force pending Supreme Court review, while the reciprocal tariff framework enacted in August continues to impose 10%–41% duties on goods from more than sixty trading partners, keeping tariff risk a central factor in supply chain planning.
- Monthly TEU volumes between 2.4M and 2.6M. This level has historically been a key pressure point for U.S. ports and inland logistics networks. November volumes eased further to 2.18M TEUs, remaining well below the 2.4M–2.6M TEU pressure range. The continued softness reflects typical seasonal slowing driven by November’s shorter month and holiday-related impacts, combined with cautious importer behavior.
- Port transit wait times. If they decrease, it’s an indication of improved global supply chain efficiencies or that the demand for goods and logistics services is declining. In November 2025, most major ports experienced modest increases in transit delays, though overall conditions remained stable with no signs of significant congestion.
- The economy. The U.S. is an import-driven economy, so economic health is an important indicator of container import volumes. Recent data continue to show softness in the U.S. labor market, which could weigh on container import volumes. In November 2025, private employers shed 32,000 jobs according to the latest Automatic Data Processing (ADP) National Employment Report. Meanwhile, the most recent official data (September) show non-farm payrolls up by 119,000 jobs, with the unemployment rate holding at 4.4%. Together, these indicators suggest that wage and employment strength is weakening, which may dampen consumer demand. With uncertainty around labor markets and demand, economic headwinds remain an important risk factor for U.S. import flows.
- Middle East conflict. Although attacks have eased, security risks in the Red Sea remain, and most major carriers continue to avoid Suez transits. Industry updates show that operators are unlikely to reverse Cape of Good Hope detours without stronger safety assurances, keeping longer transit times and elevated costs in place for now.
Consider recommendations to help minimize global shipping challenges.
November 2025 import volumes declined to 2.18M TEUs, reflecting the typical seasonal slowdown. While port operations remained stable, tariff policies and prolonged Red Sea rerouting continue to complicate planning for importers. Recent U.S.–China policy adjustments have eased some near-term tariff pressure, but the long-term outlook remains unclear. At the same time, a cooling U.S. economic backdrop adds further uncertainty. Descartes continues to monitor these evolving conditions through Descartes Datamyne, government releases, and industry sources to help importers anticipate disruptions, optimize logistics performance, and build supply chain resilience in a fluid global trade environment.
Short-term:
- Model the effects of the new U.S.–China trade framework, including reduced tariffs on Chinese goods and suspended retaliatory measures, while also accounting for uncertainty tied to Liberation Day tariff litigation.
- Monitor port volumes and delays to assess the possibility of trade disruptions if volumes persist within the 2.4M and 2.6M levels that have historically stressed U.S. maritime logistics infrastructure.
- Track the Middle East conflict as carriers continue to avoid the Red Sea due to Houthi attacks, and heightened Iran–Israel tensions, with rerouting expected to persist.
- Evaluate the impact of inflation and the Russia/Ukraine, Israel/Hamas, and Iran/Israel conflicts on logistics costs and capacity constraints. Ensure that key trading partners are not on sanctions lists.
Near-term:
- For companies that have cargo moving through the Suez Canal and the Strait of Hormuz, evaluate the impact of extended rerouting.
Long-term:
- Evaluate supplier and factory location density to mitigate reliance on over-taxed trade lanes and regions of the globe currently experiencing geopolitical conflict or that have the potential for conflict. Density creates economy of scale but also risk, and subsequent logistics capacity crisis highlights the downside.
Notes:
- This report uses the initial compiled release of publicly available U.S. Customs and Border Protection (CBP) Bill of Lading (BOL) data for all U.S. ports, which provides a standard, official source of data for reporting on maritime trade. This data can be subject to modification later by CBP. The modified data can be seen in Descartes Datamyne™ where U.S. maritime records are processed daily. Descartes Datamyne is ISO 9001 certified.
- In Descartes Datamyne™, twenty-foot equivalent units (TEU) are calculated using a combination of container size and weight as declared on Bills of Lading filed with U.S. Customs and Border Protection (CBP).
Subscribe to the Global Shipping Report
Stay informed with the latest shipping trends and U.S. container import logistics data every month with the Descartes Global Shipping Report
About Descartes Datamyne
Leverage the Power of Global Import and Export Trade Data
Optimize trade lanes, expand into new markets, discover alternative buyers and suppliers, as well as spot supply and demand shifts from a single integrated web-based platform to cost-effectively enhance your supply chain resilience and competitive edge.
Special Reports
2024 Top 30 U.S. Port Report
Stay informed with the annual U.S. Port Report from Descartes, ranking 2024 Maritime Port performance and trends in a year that defied expectations.
Download the 2024 Top 30 U.S. Port Report

What Companies are Doing to Tackle Escalating Global Supply Chain Challenges
Offering must-read insights for global trade, this white paper provides an overview of the key challenges facing global supply chain leaders as discovered through Descartes’ 2024 Global Trade Intelligence Survey.
Download the White Paper
How Descartes Can Help
Descartes Datamyne delivers business intelligence with comprehensive, accurate, up-to-date, import and export information.
Our multinational trade data assets can be used to trace global supply chains and our bill-of-lading trade data – with cross-references to company profiles and customs information – can help businesses identify and qualify new sources. Ask us for a free, no obligation demonstration of our data on a product or trade commodity of your choosing – and keep the custom research we create with our compliments.