The Global Shipping Report
July U.S. Container Imports Near Record High as China Volumes Rebound and Tariff Deadlines Tighten
Stay informed with the latest insights from the Descartes Global Shipping Report
Data for the Global Shipping Report provided by Descartes Datamyne
In July 2025, U.S. container imports surged to 2,621,910 twenty-foot equivalent units (TEUs), up 18.2% from June and 2.6% higher than July 2024—and just 555 TEUs shy of the all-time record set in May 2022. The increase reflects both strong seasonal demand, which typically drives higher volumes in July, and accelerated shipments in response to shifting trade policies. While port transit time delays increased modestly at top U.S. ports in July, the rise was relatively mild given the sharp month-over-month growth in import volumes, indicating that infrastructure is continuing to perform under elevated volumes.
Imports from China climbed to 923,075 TEUs in July—a 44.4% month-over-month increase and the highest level in 2025 since January. China’s share of U.S. imports rose to 35.2% in July, up from 28.8% in June, though still below the 41.5% peak seen in February 2022. The rebound follows a sharp contraction in May and June, when the end of the de minimis exemption and elevated uncertainty with respect to tariffs weighed on shipment flows. The July recovery reflects a combination of seasonal demand and suspected frontloading in response to the 30% temporary tariff rate on Chinese imports set to expire in mid-October.
While global supply chains continue to grapple with ongoing Red Sea disruptions, driven by Houthi attacks and Iran–Israel tensions, trade policy developments remain the dominant force shaping import behavior. On August 1, the U.S. enacted a broad set of reciprocal tariffs targeting over 60 countries, including the EU, Canada, Japan, and South Korea, with rates ranging from 10% to 41%. Additional measures include a 25% tariff on Indian exports (effective August 7) and a universal 50% duty on copper. The repeal of the de minimis exemption for all countries will follow on August 29, replacing duty-free treatment for parcels under US$800 with flat-rate fees of US$80–$200 per item—likely to significantly disrupt cross-border ecommerce.
In this Article...
- toc
U.S. container imports surge in July, hitting second-highest level on record.
In July 2025, U.S. container import volumes jumped to 2,621,910 TEUs, rising 18.2% from June and surpassing all monthly totals since the May 2022 record of 2,622,465 TEUs (see Figure 1). Reversing slower activity in May and June, July volumes grew 2.6% year-over-year compared to July 2024. Compared to pre-Covid July 2019, volumes were up 19.3%, highlighting long-term structural growth in import demand. On a year-to-date basis, total TEUs through July are now tracking 3.6% ahead of the same period in 2024 as tariff-driven shipment acceleration ahead of expected policy tightening continues. While trade policy played a major role in July’s spike, the increase is also consistent with seasonal patterns, which have shown July gains over the last nine years.
Figure 1: U.S. Container Import Volume Year-over-Year Comparison
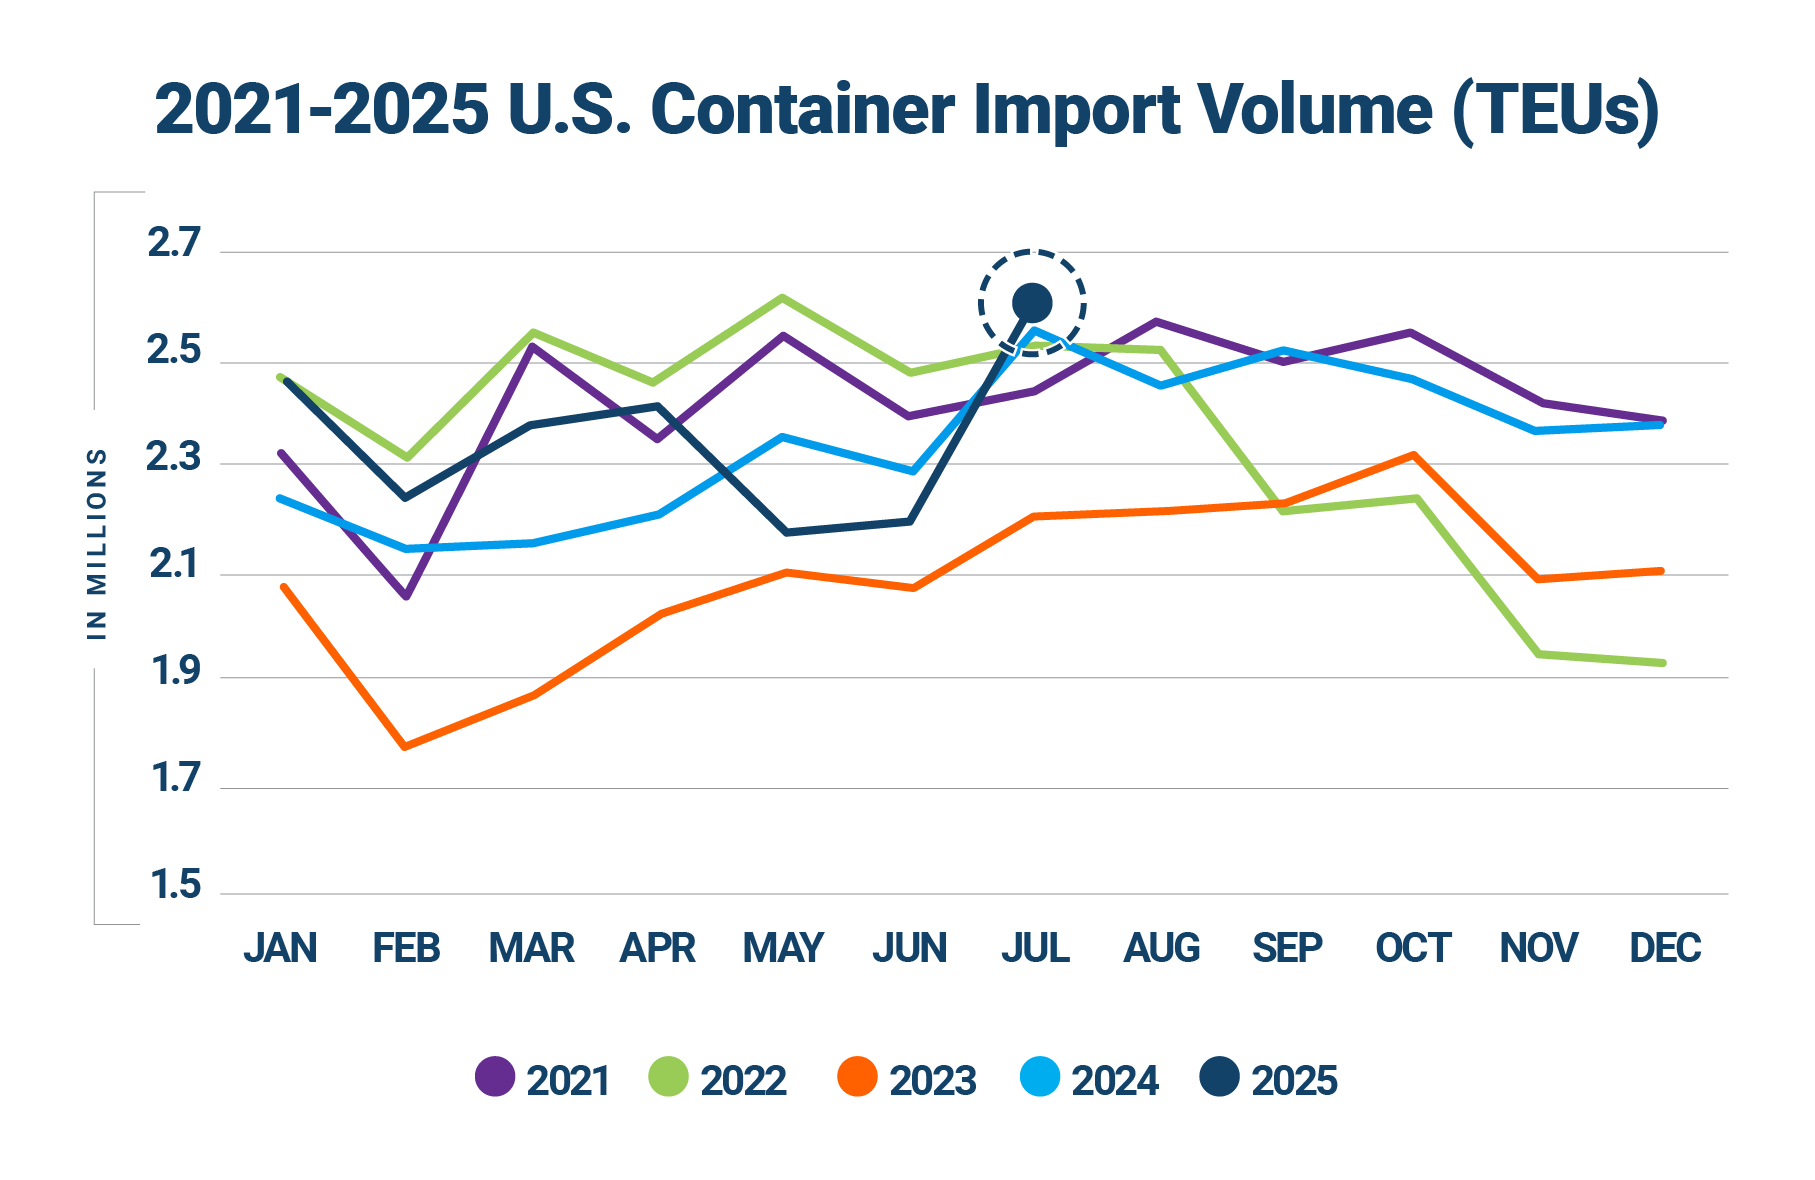
Source: Descartes Datamyne™
July 2025 import volumes rose 18.2% (404,235 TEUs) over June (see Figure 2). The increase is well above the 11.2% month-over-month gain last year and marks the strongest month-over-month rise since early 2021 when February import volumes climbed 23% (469,996 TEUs) over March. While consistent with the rise in peak ocean shipping season that occurs in non-pandemic years, July volumes also reflect suspected aggressive frontloading ahead of impending trade policy shifts, including the October expiration of the U.S.–China tariff truce and the August 29 repeal by the U.S. of its de minimis exemption for all countries. July’s performance underscores how tariff timing, not just seasonal demand cycles, is increasingly shaping U.S. import volumes.
Figure 2: June to July U.S. Container Import Volume Comparison

Source: Descartes Datamyne™
Top 10 U.S. ports post strong gains in July, with growth across all major gateways.
In July 2025, container volumes at the top 10 U.S. ports rose by 20.4% month-over-month, with a combined net gain of 379,578 TEUs (see Figure 3). The growth was broad-based, with significant increases at both West Coast and East/Gulf Coast ports. Miami led all major ports with a 35.5% increase in July, followed by Houston at 34.2%, Oakland at 31.3%, and Savannah at 25.2%. Long Beach and Los Angeles posted strong gains of 24.1% and 18.0%, respectively. New York/New Jersey rose 14.7%, while Charleston and Norfolk each grew by over 12%. Tacoma recorded a more modest increase of 1.7%. In addition to seasonal demand, the across-the-board rise in port activity reflects widespread suspected frontloading ahead of potential tariff policy changes and reinforces the strength of U.S. maritime imports.
Figure 3: June 2025 to July 2025 Comparison of Import Volumes at Top 10 U.S. Ports

Source: Descartes Datamyne™
China-origin imports rebound significantly in July.
U.S. containerized imports from China rose sharply to 923,075 TEUs in July 2025, a dramatic 44.4% increase over June and marking the strongest monthly volume since January. Compared to the record high set in July 2024 of 1,022,913 TEUs, July volumes were down 9.8% (99,838 TEUs) (see Figure 4). China’s share of total U.S. imports rose to 35.2%—its highest since early 2025 but still trailing the record 41.5% share seen in February 2022. This rebound reflects strong suspected frontloading ahead of the temporary U.S.–China tariff truce, extended through October 15, and the August 29 repeal of the de minimis exemption for all countries.
While the recovery was broad, top product categories continued to reflect China’s dominant export profile. Furniture and bedding (HS-94), plastics (HS-39), and machinery (HS-84) remained the top three categories by volume, together accounting for over 38% of China-origin TEUs. Other major segments included toys and sporting goods (HS-95), electric machinery (HS-85), and vehicles and parts (HS-87). The composition reinforces China’s ongoing strength in consumer and industrial manufacturing, even as longer-term sourcing shifts remain in motion.
Despite the strong rebound, structural headwinds persist. Elevated tariffs, intensified customs enforcement, and the June enactment of a 40% U.S. tariff on re-exports from Vietnam—intended to crack down on transshipped Chinese goods—continue to cloud the outlook. Without a deeper tariff rollback or broader trade agreement, China’s share of U.S. containerized trade may face renewed pressure.
Figure 4: July 2024–July 2025 Comparison of U.S. Total and Chinese TEU Container Volume Relative to Chinese Import Record

Source: Descartes Datamyne
China-origin volumes recover sharply across both coasts, led by major East and Gulf Coast gains.
In July 2025, China-origin imports surged across the top 10 U.S. ports, increasing by 262,126 TEUs overall—a 42.9% month-over-month gain (see Figure 5). While West Coast gateways like Los Angeles (33.6%) and Long Beach (26.7%) continued to show strong recoveries, the most dramatic growth occurred at East and Gulf Coast ports. Houston led all ports with a 122.0% spike in China-origin volumes, followed by Savannah (90.2%), New York/Newark (69.5%), and Charleston (78.9%). Norfolk (51.4%) and Oakland (53.9%) also posted sizable increases. Even typically lower-volume West Coast ports like Tacoma (10.2%) and Seattle (14.0%) saw gains. The across-the-board growth marks a reversal from prior months of contraction and underscores the responsiveness of trans-Pacific routing strategies to shifting policy signals.
Figure 5: June 2025 to July 2025 Comparison of top U.S. Ports for Imports Originating from China

Source: Descartes Datamyne
U.S. imports from top 10 CoOs surge in July, led by significant increases from China and Hong Kong.
In July 2025, U.S. containerized imports from the top 10 CoOs jumped 25.4% month-over-month, an increase of 382,800 TEUs (see Figure 6). China drove the surge with an impressive gain of 283,775 TEUs, up 44.4% from June, recovering from prior months of tariff-driven weakness. Hong Kong also posted a notable increase, rising 25,185 TEUs (47.8%). Strong contributions also came from across Asia: South Korea rose 15,779 TEUs (16.8%), India 14,658 TEUs (13.6%), Thailand 12,975 TEUs (13.1%), and Japan 12,263 TEUs (23.3%). Vietnam, Taiwan, and Italy posted more moderate gains of 12,438 TEUs (4.5%), 3,949 TEUs (6.4%), and 2,153 TEUs (3.6%), respectively. Germany was the only country in the top 10 to show a decline, down 374 TEUs (0.6%). These widespread increases suggest a resurgence in Asia-origin shipments among U.S. importers.
Figure 6: June 2025 to July 2025 Comparison of U.S. Import Volumes from Top 10 Countries of Origin

Source: Descartes Datamyne
Year-over-year, Southeast Asia continues to drive July import growth.
In July 2025, U.S. containerized imports from the top 10 CoOs dipped slightly by 0.3% compared to July 2024, with a net loss of 6,199 TEUs (see Figure 7). The marginal decline was largely due to a 9.8% drop in imports from China—a notable decrease, though measured against an all-time monthly high in July 2024 of 1,022,913 TEUs. Meanwhile, Southeast Asian sourcing continued to accelerate year-over-year: India rose 24.0%, Thailand 23.8%, and Vietnam 20.9%. Japan (12.1%) and Italy (4.5%) also gained, while South Korea and Germany saw declines of 5.8% and 7.3%, respectively. The data underscores how China remains a dominant, though currently volatile, source while other Asian countries deepen their trade ties with U.S. importers amid ongoing diversification and shifting tariff policies.
Figure 7: July 2024 to July 2025 Comparison of U.S. Import Volumes from Top 10 Countries of Origin

Source: Descartes Datamyne™
West Coast ports hold gains in July as East and Gulf Coast shares edge higher.
In July 2025, top West Coast ports increased their market share slightly to 45.8%, up from 45.4% in June and marking the strongest position since January (see Figure 8). East and Gulf Coast ports also rebounded modestly, rising to 39.3% from 38.7% the prior month, though still below May’s 44.5% peak. The stabilization in port shares follows the extension of the U.S.–China tariff truce through October, which has supported stronger China-origin volumes that are typically routed through Pacific gateways. Overall, the top 10 U.S. ports handled 85.1% of total containerized imports in July, a slight gain from 84.1% in June.
Figure 8: Volume Analysis for Top Ports, West Coast Ports and East and Gulf Coast Ports

Source: Descartes Datamyne™
Port delays extend modestly in July.
Despite a dramatic increase in July import volumes at top U.S. ports, transit time delays have increased only modestly over June, indicating that gateways are absorbing the added pressure without major disruption (see Figure 9). The increase reflects delays across both East and West Coast ports. In the East, New York/New Jersey, (0.6 days), Savannah (0.4 days), Charleston (0.3 days), and Houston (0.1 days) experienced small increases in delays. On the West Coast, Los Angeles (0.5 days), Long Beach (0.8), and Oakland (0.4) also experienced small delays after strong improvements the prior month. Only Tacoma showed a modest decrease in delays, improving to 2.9 days. Seattle held steady at 6.5 days, unchanged from June.
Figure 9: Monthly Average Transit Delays (in days) for the Top 10 Ports (May. 2025 – Jul. 2025)

Source: Descartes Datamyne™
Note: Descartes’ definition of port transit delay is the difference as measured in days between the Estimated Arrival Date, which is initially declared on the bill of lading, and the date when Descartes receives the CBP-processed bill of lading data.
Trusted by
Stay informed with monthly shipping insights with the Global Shipping Report

Director, Industry Strategy, Global Trade Intelligence, Descartes

Gulf Coast imports rise sharply in July after steep June decline.
In July 2025, Gulf Coast container imports rose 28.6% to 247,982 TEUs, up from 192,883 TEUs in June (see Figure 10). The rebound recovers much of June’s drop but still leaves volumes slightly below May’s peak of 256,491 TEUs. July’s total came in just 0.8% above the rolling 12-month average of 230,318 TEUs, suggesting a partial stabilization following tariff-driven volatility in early summer. While Gulf Coast ports have overall been resilient this year, recent fluctuations may reflect growing sensitivity to policy shifts and frontloading cycles that continue to ripple across U.S. port activity.
Figure 10: August 2024 to July 2025 U.S. Gulf Coast Container Imports

Source: Descartes Datamyne™
U.S.–China truce extended through October amid fragile trade progress and unresolved disputes.
As of July 2025, the U.S.–China trade relationship remains under a fragile but extended truce: U.S. tariffs on Chinese imports were lowered from a peak of 145% to 30% in mid‑May, and the 90-day suspension was extended through mid-October following high-level talks in Stockholm in late July. Progress has unfolded on implementing the Geneva/London framework, with China agreeing to resume rare earth exports under a six‑month licensing regime, and the U.S. lifting restrictions on chip design software, ethane, and jet engines to China. Despite these measures, tensions over intellectual property enforcement, coerced tech transfers, and state-driven industrial subsidies remain unresolved. Analysts warn that without a deeper, enforceable agreement, there is a real risk that tensions, tariff snapbacks, and supply chain disruptions could return as the truce nears its expiration.
Tariff deadlines reshape global trade flows.
As of July 2025, shipping disruptions in the Red Sea intensified amid escalating Iran–Israel tensions and renewed Houthi targeting of commercial vessels. The Houthis declared a new “fourth phase” in their naval blockade, vowing to attack ships linked to companies dealing with Israeli ports, regardless of nationality. These actions sharply increased maritime risk, prompting major carriers—including Maersk, MSC, and Hapag‑Lloyd—to bypass the Suez Canal and reroute ships around the Cape of Good Hope.
Traffic through Bab el‑Mandeb remained approximately 50% below early‑2024 levels, and weekly transits have stabilized at near 200 voyages—less than half of pre‑crisis volumes. Transit times on Asia–Europe and Asia–East Coast U.S. routes have lengthened by up to two weeks, and freight and insurance costs have increased. With no signs of de-escalation and detours expected to persist as late as August or beyond, global shipping continues adapting to sustained corridor disruption.
Red Sea risks escalate as Houthi threats intensify and rerouting persists through July.
As of July 2025, shipping disruptions in the Red Sea intensified amid escalating Iran–Israel tensions and renewed Houthi targeting of commercial vessels. The Houthis declared a new “fourth phase” in their naval blockade, vowing to attack ships linked to companies dealing with Israeli ports, regardless of nationality. These actions sharply increased maritime risk, prompting major carriers—including Maersk, MSC, and Hapag‑Lloyd—to bypass the Suez Canal and reroute ships around the Cape of Good Hope.
Traffic through Bab el‑Mandeb remained approximately 50% below early‑2024 levels, and weekly transits have stabilized at near 200 voyages—less than half of pre‑crisis volumes. Transit times on Asia–Europe and Asia–East Coast U.S. routes have lengthened by up to two weeks, and freight and insurance costs have increased. With no signs of de-escalation and detours expected to persist as late as August or beyond, global shipping continues adapting to sustained corridor disruption.
Managing supply chain risk: what to watch in 2025.
In July 2025, U.S. container imports surged, but trade uncertainty remains high. China-origin volumes rebounded from June lows but stayed 9.8% below the all-time peak set in July 2024. The U.S.–China tariff truce has been extended through mid-October, while broader reciprocal tariffs on over 60 countries took effect August 1, increasing costs for many U.S. importers across key sectors. The U.S. repeal of its de minimis exemption for all countries begins August 29, further impacting low-value imports. Red Sea disruptions and Eastern European sanctions continue to strain global trade routes. With tariffs tightening and geopolitical risks escalating, importers are facing the pressure of sustained uncertainty. Here’s what Descartes is monitoring in the months ahead:
- Expanded tariffs and other potential ‘protectionist’ trade policies. Broader and deeper tariffs applied to a wide array of goods could compel U.S. importers to significantly re-engineer their supply chains, putting additional pressure on global logistics infrastructure. While U.S. tariffs on Chinese imports peaked at 145% in April, a temporary 30% rate remains in effect through October 15 under the extended U.S.–China truce. Imports from China fell in May but rebounded in July as importers adjusted. The de minimis exemption for China was revoked in May, replaced with a 54% flat rate per parcel. Separately, sweeping U.S. reciprocal tariffs took effect August 1 on over 60 countries—including the EU, Canada, Japan, and Mexico—with rates up to 41%, plus a universal 50% tariff on copper and a 25% duty on Indian exports starts on August 7. These overlapping measures are prompting U.S. importers to consider frontloading and diversification amid intensifying trade pressure.
- Monthly TEU volumes between 2.4M and 2.6M. This level remains a key pressure point for U.S. ports and inland logistics networks. In July 2025, U.S. container import volumes reached 2.62 million TEUs, a sharp rebound from June and just below the all-time record set in May 2022. The increase pushed volumes back into the 2.4–2.6 million TEU range that historically signals peak infrastructure demand. While July’s spike may reflect pre-tariff frontloading and temporary policy reprieves, it likely represents a high-water mark rather than a sustained trend, as looming tariff expirations and slowing demand point to potential declines in the months ahead.
- Port transit wait times. If they decrease, it’s an indication of improved global supply chain efficiencies or that the demand for goods and logistics services is declining. In July 2025, port transit delays edged up across most major U.S. gateways, extending modestly despite a sharp rise in import volumes. Both East and West Coast ports saw slight increases, suggesting port capacity may be tightening but is not yet overwhelmed.
- The economy. The U.S. is an import-driven economy, so economic health is an important indicator of container import volumes. In July 2025, the U.S. labor market showed clear signs of softening, with only 73,000 jobs added and the unemployment rate ticking up to 4.2%. Revisions to previous months sharply cut May and June payroll gains by a combined 258,000, revealing a weaker trend than initially reported. At its July 30 meeting, the Federal Reserve again held interest rates steady at 4.25%–4.50% for the fifth straight time, as policymakers weighed easing labor momentum against inflation that remains above target. With the U.S.–China tariff truce set to expire in October and delayed global tariffs now approaching enforcement, businesses face growing uncertainty as both economic and policy signals remain mixed heading into late 2025.
- Middle East conflict. Houthi-related threats continue to divert carriers from the Suez Canal, extending transit times and raising shipping costs as vessels reroute around the Cape of Good Hope. The ceasefire earlier this year has collapsed, with Houthi forces launching a new wave of attacks in July targeting vessels linked to Israeli ports. Ongoing Iran–Israel tensions have further destabilized the Red Sea and Strait of Hormuz, prompting continued U.S. strikes in Yemen and sustained naval escort operations. Major carriers remain diverted around the Cape of Good Hope, extending transit times and costs. While East and Gulf Coast ports remain stable, the risk of broader disruptions continues to grow.
Consider recommendations to help minimize global shipping challenges.
In July 2025, following two months of uneven performance, U.S. container import volumes surged driven by a combination of seasonal demand and potential tariff-related frontloading. Port conditions remained stable, with improved throughput at key gateways including Los Angeles, Long Beach, and New York/New Jersey. However, persistent volatility—including the Red Sea crisis, stricter enforcement on China-linked transshipments, and uncertain economic signals—continues to challenge global supply chains. Descartes is closely tracking these developments through Descartes Datamyne, alongside government and industry sources, to help importers mitigate risk and adapt their operations in a rapidly shifting trade landscape.
Short-term:
- Consider modelling the impacts of expanded U.S. tariffs, including the August 1 implementation of reciprocal duties on over 60 countries, the August 7 start of India-specific tariffs and the universal copper tariff, and the October 15 expiration of the U.S.–China tariff truce.
- Monitor port volumes and delays to assess the possibility of trade disruptions if volumes persist within the 2.4M and 2.6M levels that have historically stressed U.S. maritime logistics infrastructure.
- Track the Middle East conflict as carriers continue to avoid the Red Sea due to escalating Houthi attacks, and heightened Iran–Israel tensions, with rerouting expected to persist.
- Evaluate the impact of inflation and the Russia/Ukraine, Israel/Hamas, and Iran/Israel conflicts on logistics costs and capacity constraints. Ensure that key trading partners are not on sanctions lists.
Near-term:
- For companies that have cargo moving through the Suez Canal and the Strait of Hormuz, evaluate the impact of extended rerouting caused by Middle East conflicts.
Long-term:
- Evaluate supplier and factory location density to mitigate reliance on over-taxed trade lanes and regions of the globe that have the potential for conflict. Density creates economy of scale but also risk, and subsequent logistics capacity crisis highlights the downside. Conflicts do not happen “overnight” so now is an optimal time to address this potentially business disrupting issue.
1. U.S. tariff rates cited in this report were current as of 4pm ET on August 7, 2025.
2. This report uses the initial compiled release of publicly available U.S. Customs and Border Protection (CBP) Bill of Lading (BOL) data for all U.S. ports, which provides a standard, official source of data for reporting on maritime trade. This data can be subject to modification later by CBP. The modified data can be seen in Descartes Datamyne™ where U.S. maritime records are processed daily. Descartes Datamyne is ISO 9001 certified.
3. In Descartes Datamyne™, twenty-foot equivalent units (TEU) are calculated using a combination of container size and weight as declared on Bills of Lading filed with U.S. Customs and Border Protection (CBP).
Subscribe to the Global Shipping Report
Stay informed with the latest shipping trends and U.S. container import logistics data every month with the Descartes Global Shipping Report
About Descartes Datamyne
Leverage the Power of Global Import and Export Trade Data
Optimize trade lanes, expand into new markets, discover alternative buyers and suppliers, as well as spot supply and demand shifts from a single integrated web-based platform to cost-effectively enhance your supply chain resilience and competitive edge.
Special Reports
2024 Top 30 U.S. Port Report
Stay informed with the annual U.S. Port Report from Descartes, ranking 2024 Maritime Port performance and trends in a year that defied expectations.
Download the 2024 Top 30 U.S. Port Report

What Companies are Doing to Tackle Escalating Global Supply Chain Challenges
Offering must-read insights for global trade, this white paper provides an overview of the key challenges facing global supply chain leaders as discovered through Descartes’ 2024 Global Trade Intelligence Survey.
Download the White Paper
How Descartes Can Help
Descartes Datamyne delivers business intelligence with comprehensive, accurate, up-to-date, import and export information.
Our multinational trade data assets can be used to trace global supply chains and our bill-of-lading trade data – with cross-references to company profiles and customs information – can help businesses identify and qualify new sources. Ask us for a free, no obligation demonstration of our data on a product or trade commodity of your choosing – and keep the custom research we create with our compliments.