The Global Shipping Report
May Shows Significant Decrease in U.S. Container Import Volumes Led by Sharp Decline in Imports from China
Stay informed with the latest insights from the Descartes Global Shipping Report
Data for the Global Shipping Report provided by Descartes Datamyne
In May 2025, U.S. container imports declined sharply after several months of growth, falling 9.7% from April and 7.2% year-over-year to 2,177,453 twenty-foot equivalent units (TEUs)—the lowest monthly total since March 2024 (2,145,341 TEUs). The drop followed a wave of frontloading in April and reflects a broader adjustment to shifting trade policies, including the expiration of the de minimis exemption and ongoing tariff volatility. Although the U.S. lowered tariffs on goods imported from China to 30% under a 90-day truce effective May 14, most imports that arrived in May were booked under the earlier, higher rates. Port dynamics also shifted in May, with East and Gulf Coast ports gaining share as volumes at West Coast ports declined. Port delays remained steady across most major gateways, though Los Angeles and Long Beach experienced increases despite lower volumes.
U.S. imports from China fell to 637,001 TEUs—a 20.8% drop from April and 28.5% year-over-year. This was the steepest monthly decline since March 2020 and marks a clear pullback following April’s surge, as importers adjusted to increased costs and regulatory uncertainty. Despite the decline, China remains the top U.S. maritime trade partner by a significant margin; however, continued policy volatility and diversification efforts are likely to keep pressure on China-origin volumes in the coming months.
Beyond shifting trade flows, broader supply chain challenges continue to emerge. Instability in key corridors—particularly in the Red Sea—remains a persistent disruptor, while softening economic conditions in major markets are beginning to weigh on global demand. At the same time, tariff volatility and evolving sourcing and routing dynamics are altering port usage. As these conditions unfold, businesses should consider remaining agile—closely tracking geopolitical developments, adjusting import strategies, and building resilience into global supply chains.
In this Article...
- toc
U.S. container import volumes retreat as tariff impacts emerge.
In May 2025, U.S. container import volumes declined to 2,177,453 TEUs—a 9.7% drop from April (see Figure 1). Year-over-year, volumes were down 7.2% compared to May 2024 but 4.3% above May 2019, signaling that overall demand remains elevated versus pre-pandemic norms. Despite strong early-year performance, the May decline marks the first significant contraction reflecting the impact of tariff volatility and growing trade pressures. Cumulatively, total imports for the first five months of the year are up 5.3% compared to the same period in 2024, though the gap has narrowed as evolving trade policies reshape global trade flows.
Figure 1: U.S. Container Import Volume Year-over-Year Comparison
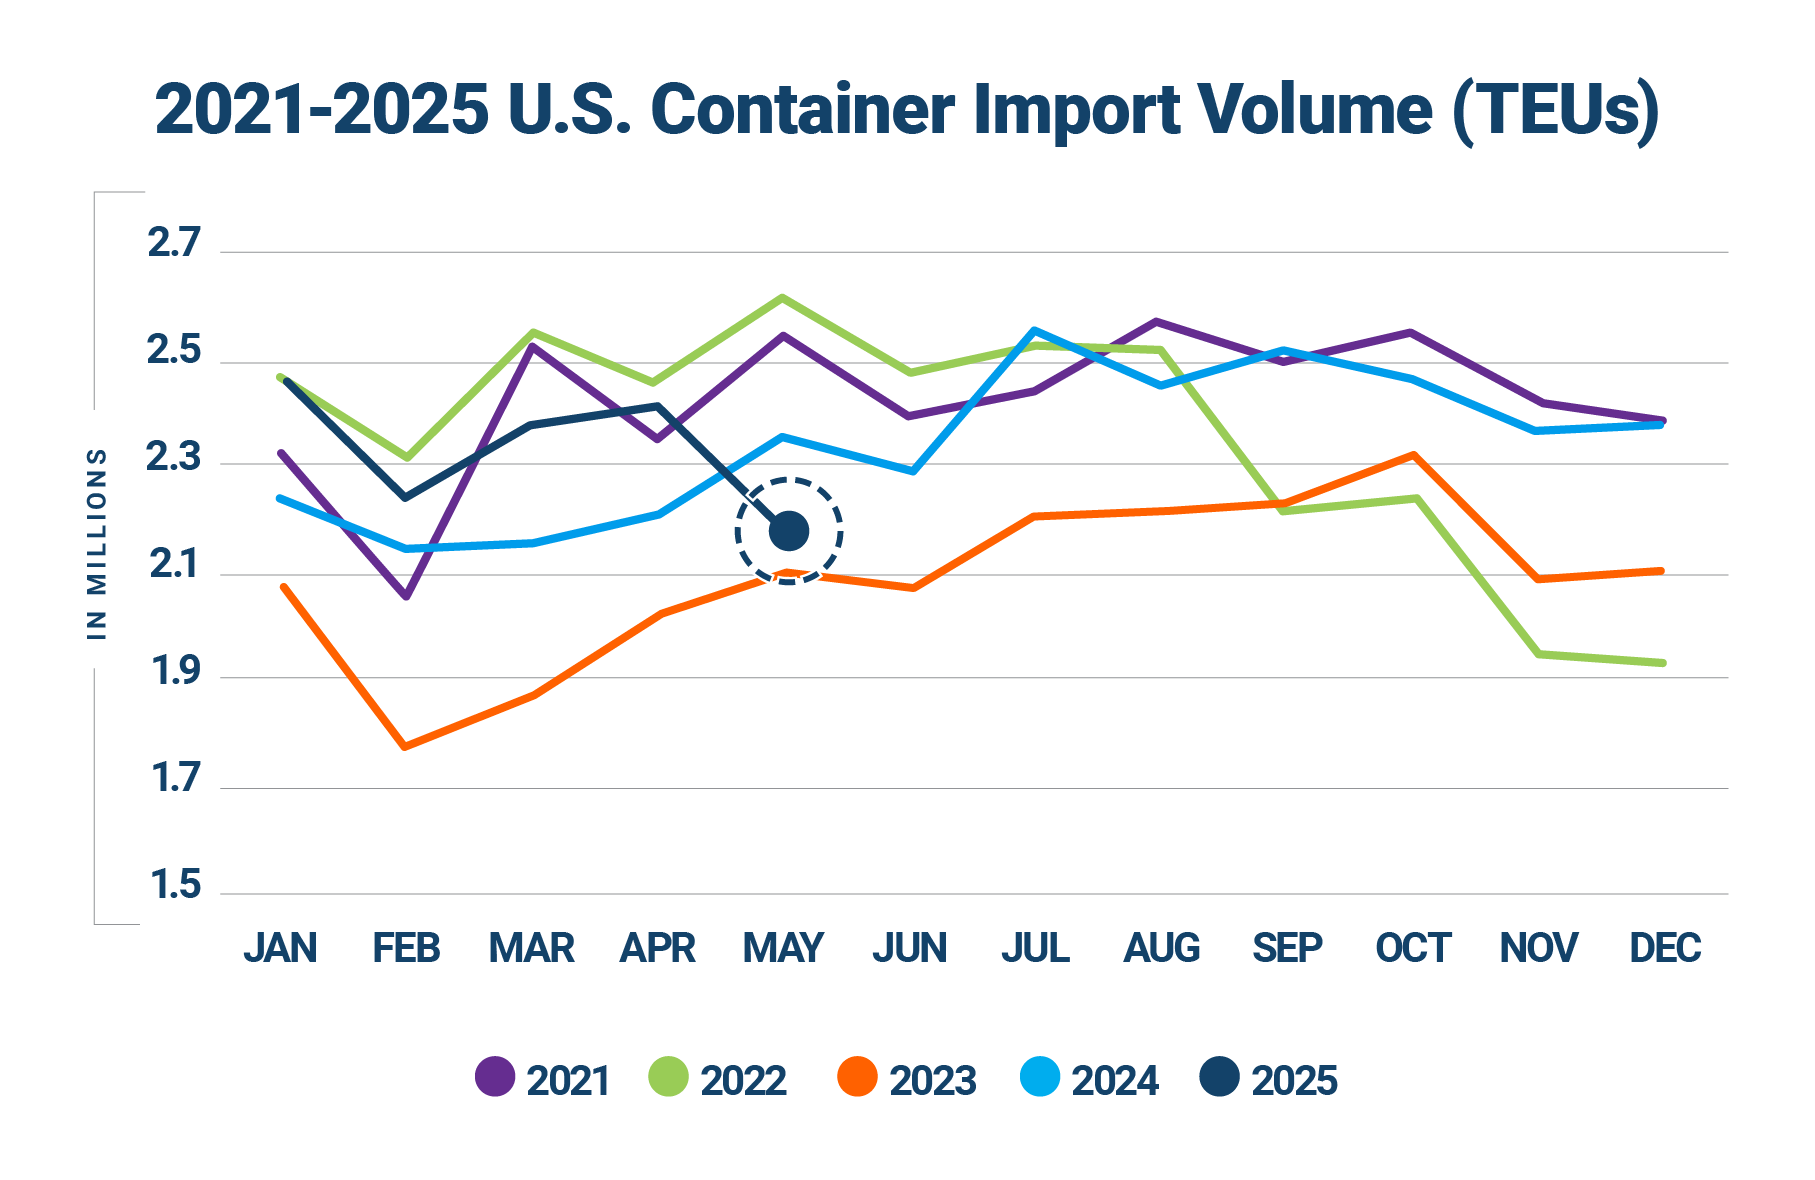
Source: Descartes Datamyne™
Historically, May is a month of rising import volumes over April; however, 2025 is the only year in the past seven to post a month-over-month decrease (9.7%), apart from pandemic 2020 (8.2%) (see Figure 2). The drop reflects the import slowdown after April frontloading, the impact of the 145% U.S. tariff on many Chinese goods, as well as the May 2 expiration of the de minimis exemption.
Figure 2: March to April U.S. Container Import Volume Comparison

Source: Descartes Datamyne™
In May 2025, container volume at the top 10 U.S. ports declined 10.7%, with a combined loss of 217,112 TEUs (see Figure 3). The two largest West Coast ports saw the steepest drops, led by Long Beach (down 22.4%) and Los Angeles (down 18.4%), together accounting for over 170,000 fewer TEUs. Tacoma also posted a significant decline of 25.6%. Houston fell 8.6% while Savannah (down 3.8%), New York/New Jersey (down 2.9%) and Oakland (down 2.2%) experienced more modest drops. In contrast, a few ports bucked the trend: Charleston grew 6.0% and Baltimore rose 2.6%, reflecting more resilient regional demand and/or rerouted shipments. Overall, the downturn suggests a broad-based contraction in import activity across a majority of U.S. gateways.
Figure 3: April 2025 to May 2025 Comparison of Import Volumes at Top 10 U.S. Ports

Source: Descartes Datamyne™
U.S. imports from China fall sharply in May as tariffs affect volumes.
U.S. imports from China fell to 637,001 TEUs in May 2025, a drop of 20.8% from April and 28.5% year-over-year (see Figure 4). In addition, China’s share of total U.S. containerized imports fell to 29.3% in May, its lowest level in over two years, though it remains the leading U.S. maritime trade partner. The steep decline in volume and share reflects the impact of the 145% tariff implemented on April 9. Although a 90-day U.S.–China agreement took effect on May 14—lowering tariffs on Chinese imports to 30% through mid-August—the sharp drop in May volumes likely reflects a pause in ordering and shipment activity as businesses reassess sourcing strategies under new cost structures. Since new tariffs on goods from China do not apply to shipments already in transit, April volumes captured a wave of frontloading, while May figures show the early impact of policy changes.
Furniture and bedding (HS-94) remained the leading import category from China in May, accounting for 16.04% of the country’s U.S.-bound volume, or 102,162 TEUs. Plastics (HS-39) followed at 13.9% (88,368 TEUs), and nuclear reactors and machinery (HS-84) comprised 12.1% (77,099 TEUs). Other key categories included electric machinery (HS-85) at 7.8% (49,930 TEUs), articles of iron or steel (HS-73) at 6.8% (40,895 TEUs), and toys and sporting goods (HS-95) at 5.9% (37,811 TEUs). Many of these categories are expected to face continued headwinds under elevated tariff conditions.
The effects of U.S. policy shifts with China are now clearly visible in monthly trade flows, and China-origin imports may continue to soften in the months ahead as importers reassess sourcing strategies amid rising landed costs. In addition, although the full duty exemption under the de minimis threshold has ended, the regulation remains in place: as of May 14, 2025, low-value imports are subject to revised tariffs, including a reduced 54% ad valorem rate and a retained $100 per-package fee for postal shipments—increases that may also contribute to softening volumes.
Figure 4: May 2024–May 2025 Comparison of U.S. Total and Chinese TEU Container Volume Relative to Chinese Import Record

Source: Descartes Datamyne
At the port level, China-origin imports declined sharply in May across nearly all major U.S. gateways (see Figure 5). Long Beach and Los Angeles experienced the steepest drops, down 31.6% and 29.9%, respectively, accounting for a combined loss of nearly 129,000 TEUs. Other West Coast ports such as Tacoma (down 43.6%) and Seattle (down 39.2%) also posted significant declines. Among East and Gulf Coast ports, the decreases were more moderate—New York/Newark dropped 2.2%, Savannah 1.5%, and Charleston 4.1%. The overall month-over-month decline in China-origin volume at top ports highlights the broad pullback following frontloading activity earlier in the year, with West Coast ports bearing the brunt as trans-Pacific flows contracted most severely.
Figure 5: April 2025 to May 2025 Comparison of top U.S. Ports for Imports Originating from China

Source: Descartes Datamyne
U.S. imports from the top 10 countries of origin decline sharply in May.
U.S. containerized imports from the top 10 countries of origin (CoO) fell by 192,313 TEUs in May 2025, a decline of 11.4% from April (see Figure 6). The largest drop came from China, which decreased by over 167,000 TEUs (-20.8%) following the implementation of steep U.S. tariffs. Several other countries also saw notable declines, including Italy (-23.1%), Hong Kong
(-14.4%), and Thailand (-11.8%). Despite the overall downturn, some countries posted modest gains: India rose 5.7%, South Korea 4.9%, and Vietnam 2.3%, potentially suggesting early signs of trade volume shifting away from China.
Figure 6: April 2025 to May 2025 Comparison of U.S. Import Volumes from Top 10 Countries of Origin

Source: Descartes Datamyne
Year-over-year CoO trends show deepening decline from China, continued growth from Southeast Asia.
Comparing year-over-year U.S. volumes from the top 10 CoOs, imports from China fell by 28.5% compared to May 2024—a loss of over 253,000 TEUs that drove a broader 12.1% decline in total TEUs (see Figure 7). Meanwhile, Vietnam posted the largest gain (up 18.1%), followed by India (up 10.4%) and Thailand (up 11.1%). Taiwan also rose 4.4%. In contrast, shipments declined from Hong Kong (down 10.3%), Italy (down 8.2%), and Germany (down 5.6%), while volumes from Japan and South Korea remained relatively flat. The data may reflect adjustments in supply chains as U.S. importers respond to tariff pressures and geopolitical uncertainty.
Figure 7: May 2024 to May 2025 Comparison of U.S. Import Volumes from Top 10 Countries of Origin

Source: Descartes Datamyne™
East and Gulf Coast ports overtake West Coast in market share for May.
In May 2025, East and Gulf Coast ports increased their share of U.S. containerized imports to 44.5%, up 3.1% from April (see Figure 8). West Coast ports, by contrast, saw their share fall to 38.1%, down 4.4% from the previous month—erasing the gains made in April. This shift appears to be driven primarily by a decline in Chinese import volumes following import frontloading observed in April, which disproportionately affect West Coast gateways due to their geographic proximity and established trans-Pacific routes.
Figure 8: Volume Analysis for Top Ports, West Coast Ports and East and Gulf Coast Ports

Source: Descartes Datamyne™
West Coast port delays spike despite falling China volumes.
After hitting record lows in April, U.S. port transit delays remained mostly stable in May 2025, with the exception of Los Angeles and Long Beach, where conditions worsened noticeably. Long Beach delays rose by 5.7 days to 6.9, the highest among all tracked ports, while Los Angeles delays nearly doubled to 4.9 days (see Figure 9). These increases are particularly striking given that both ports saw volume declines driven by reduced shipments from China following the introduction of new tariff measures.
Elsewhere, delays showed little change. Seattle remained the most congested port at 7.5 days, while Oakland and Tacoma saw minimal shifts. On the East and Gulf Coasts, Savannah, Norfolk, and Houston recorded modest improvements or held steady, underscoring the overall stability outside of the West Coast.
Figure 9: Monthly Average Transit Delays (in days) for the Top 10 Ports (Mar. 2025 – May 2025)

Source: Descartes Datamyne™
Note: Descartes’ definition of port transit delay is the difference as measured in days between the Estimated Arrival Date, which is initially declared on the bill of lading, and the date when Descartes receives the CBP-processed bill of lading data.
Trusted by
Stay informed with monthly shipping insights with the Global Shipping Report

Director, Industry Strategy, Global Trade Intelligence, Descartes

Gulf Coast imports surge in May, just shy of November record.
In May 2025, Gulf Coast container imports rose 7.1% (256,491 TEUs) over April (239,465 TEUs) (see Figure 10). This marks the third consecutive month of growth and puts volumes just 2% below the 12-month peak of 261,523 TEUs recorded in November 2024. May’s total was also 11.9% above the rolling 12-month average of 229,318 TEUs.
After a period of volatility late last year, Gulf Coast ports have regained stability, showing consistent month-over-month growth since March. Unlike the more tariff-sensitive volume fluctuations seen on the West Coast, Gulf Coast ports appear to be experiencing more stable cargo flows.
Figure 10: June 2024 to May 2025 U.S. Gulf Coast Container Imports

Source: Descartes Datamyne™
Lower tariffs offer temporary relief, but U.S.–China trade tensions persist.
U.S.–China trade tensions peaked in April 2025, when the U.S. raised tariffs on a wide range of Chinese goods to 145%, following a rapid escalation from 10% in February to triple-digit levels in early April. In response, China implemented a 125% retaliatory tariff on U.S. exports effective April 10. However, both countries agreed in mid-May to temporarily de-escalate. On May 12, the U.S. and China announced a 90-day tariff reduction agreement: the U.S. lowered its tariffs on most Chinese goods to 30%, while China cut its retaliatory tariffs to 10%, effective May 14. This agreement is set to expire on August 11, 2025, and applies only to goods entering the U.S. after the effective date—imports that were in transit before this date remain subject to prior rates.
Adding further pressure to bilateral trade, the U.S. eliminated the de minimis exemption for Chinese and Hong Kong shipments valued under $800 on May 2. This change ended duty-free treatment for many ecommerce parcels, particularly impacting platforms like Temu and Shein.
While the temporary tariff relief has offered a reprieve, trade talks remain fragile. Accusations of noncompliance from both sides have already clouded the agreement’s future. Economists warn that, if negotiations falter, renewed tariff escalations, retaliatory measures, and long-term shifts in sourcing strategies could again strain global supply chains, dampen growth, and elevate inflationary pressures through the second half of 2025.
Red Sea instability continues to force rerouting of global shipping lanes.
As of June 2025, Red Sea disruptions persist amid continued Houthi attacks and failed ceasefire efforts. Major carriers are still rerouting vessels around the Cape of Good Hope, significantly extending transit times. Most new vessel capacity has shifted to longer Asia–Europe routes, tightening availability and driving up costs across major trade lanes. Despite U.S. military action and sanctions, traffic through the Bab el-Mandeb Strait remains sharply reduced.
Managing supply chain risk: what to watch in 2025.
In May 2025, U.S. container imports declined sharply led by a 20.8% drop in imports from China. While an agreement between the two countries to lower tariffs may bring U.S. importers short-term relief, uncertainty remains over whether the deal will hold. The expiration of the de minimis exemption for low-value Chinese imports continues to add cost and compliance pressures, particularly in ecommerce. At the same time, instability in the Red Sea continues and, in Eastern Europe, persistent conflict and sanctions are also straining key trade lanes. With tariffs fluctuating, geopolitical tensions unresolved, and supply chain vulnerabilities mounting, businesses face elevated risk and must remain agile. Here’s what Descartes will be closely monitoring in the months ahead:
- Expanded tariffs and other potential ‘protectionist’ trade policies. Broader and deeper tariffs applied to a wide array of goods could compel U.S. importers to significantly re-engineer their supply chains, putting additional pressure on global logistics infrastructure. While tariffs on Chinese imports peaked at 145% in April, a temporary 90-day reduction to 30% took effect mid-May. Imports from China surged in April due to frontloading but dropped 20.8% in May as the new rates took hold. Compounding trade complexity, the de minimis exemption for Chinese imports under $800 was first revoked on May 2, triggering a sharp policy shift that imposed a 120% duty or a $100 flat fee per postal package. However, this steep increase was partially rolled back on May 14, when the ad valorem rate was reduced to 54%, and the $100 fee was retained, cancelling a planned increase to $200. With trade policies evolving rapidly, U.S. businesses face heightened urgency to re-engineer supply chains for long-term cost control and resilience.
- Monthly TEU volumes between 2.4M and 2.6M. This level remains a key pressure point for U.S. ports and inland logistics networks. In May 2025, container import volumes fell to 2.18 million TEUs—below the 2.4M mark—easing some short-term pressure on infrastructure. While April saw record-low port delays despite high volumes, the May decline reflects tariff-driven pullbacks and shifting routing patterns. If volumes rebound toward the 2.4–2.6M range in future months, ongoing disruptions like Red Sea detours and inland bottlenecks could quickly reintroduce strain on the system.
- Port transit wait times. If they decrease, it’s an indication of improved global supply chain efficiencies or that the demand for goods and logistics services is declining. In In May 2025, port transit delays remained mostly stable across major U.S. ports, with the exception of notable increases at Los Angeles and Long Beach, suggesting that congestion relief largely held despite shifting trade dynamics and evolving tariff impacts.
- The economy. The U.S. is an import-driven economy, so economic health is an important indicator of container import volumes. In April 2025, the labor market remained stable, with 177,000 jobs added and the unemployment rate holding at 4.2%. However, momentum slowed in May, with private-sector job gains falling to just 37,000—the weakest reading since early 2023. At its May 6–7 meeting, the Federal Reserve held interest rates steady at 4.25%–4.50%, citing increased economic uncertainty and persistent inflation concerns. Meanwhile, the U.S. services sector unexpectedly contracted in May for the first time in nearly a year, signaling potential headwinds for consumer demand and logistics activity. With trade policy in flux and signs of softening in key sectors, businesses face a more complex economic landscape heading into the second half of 2025.
- Middle East conflict. Houthi-related threats are diverting carriers from the Suez Canal, extending transit times and increasing shipping costs as vessels reroute around the Cape of Good Hope. Although a ceasefire was declared earlier in the year, it has since broken down, with renewed attacks on commercial vessels reported in late April. In response, the U.S. has conducted fresh airstrikes on Houthi targets in Yemen, further heightening security concerns in the region. As a result, carriers have not resumed Red Sea transits, maintaining detours that significantly impact Asia–U.S. East Coast routes. So far, the impact on East and Gulf Coast ports has remained manageable, but escalation in hostilities could lead to broader supply chain disruptions and mounting pressure on global trade flows.
Consider recommendations to help minimize global shipping challenges.
In May, U.S. container import volumes declined after several months of growth, as the effects of new tariffs began to materialize. Port transit delays remained low at most major gateways, maintaining the efficiency gains seen in April—though Los Angeles and Long Beach recorded unexpectedly sharp increases despite significantly lower import volumes. Evolving U.S. trade policies, ongoing disruptions in the Red Sea, and softening economic indicators are adding new layers of complexity to global shipping. Descartes will continue to track these developments closely using Descartes Datamyne, alongside government and industry data, to help importers navigate uncertainty and maintain resilient supply chains in a dynamic trade environment.
Short-term:
- Consider modelling the impacts of increased tariffs on imported goods and whether a change in sourcing strategy could mitigate potentially higher costs.
- Monitor port volumes and delays to assess the possibility of trade disruptions if volumes are within 2.4M and 2.6M levels that have historically stressed U.S. maritime logistics infrastructure.
- Track the Middle East conflict as carriers continue to avoid the Red Sea amid ongoing Houthi threats and the breakdown of earlier ceasefire efforts.
- Evaluate the impact of inflation and the Russia/Ukraine and Israel/Hamas conflicts on logistics costs and capacity constraints. Ensure that key trading partners are not on sanctions lists.
Near-term:
- For companies that have cargo moving through the Suez Canal, evaluate the impact of extended rerouting caused by Middle East conflicts.
Long-term:
- Evaluate supplier and factory location density to mitigate reliance on over-taxed trade lanes and regions of the globe that have the potential for conflict. Density creates economy of scale but also risk, and subsequent logistics capacity crisis highlights the downside. Conflicts do not happen “overnight” so now is an optimal time to address this potentially business disrupting issue.
Notes:
1. U.S. tariff rates cited in this report were current as of 4pm ET on June 6, 2025.
2. This report uses the initial compiled release of publicly available U.S. Customs and Border Protection (CBP) Bill of Lading (BOL) data for all U.S. ports, which provides a standard, official source of data for reporting on maritime trade. This data can be subject to modification later by CBP. The modified data can be seen in Descartes Datamyne™ where U.S. maritime records are processed daily. Descartes Datamyne is ISO 9001 certified.
3. In Descartes Datamyne™, twenty-foot equivalent units (TEU) are calculated using a combination of container size and weight as declared on Bills of Lading filed with U.S. Customs and Border Protection (CBP).
Subscribe to the Global Shipping Report
Stay informed with the latest shipping trends and U.S. container import logistics data every month with the Descartes Global Shipping Report
About Descartes Datamyne
Leverage the Power of Global Import and Export Trade Data
Optimize trade lanes, expand into new markets, discover alternative buyers and suppliers, as well as spot supply and demand shifts from a single integrated web-based platform to cost-effectively enhance your supply chain resilience and competitive edge.
Special Reports
2024 Top 30 U.S. Port Report
Stay informed with the annual U.S. Port Report from Descartes, ranking 2024 Maritime Port performance and trends in a year that defied expectations.
Download the 2024 Top 30 U.S. Port Report

What Companies are Doing to Tackle Escalating Global Supply Chain Challenges
Offering must-read insights for global trade, this white paper provides an overview of the key challenges facing global supply chain leaders as discovered through Descartes’ 2024 Global Trade Intelligence Survey.
Download the White Paper
How Descartes Can Help
Descartes Datamyne delivers business intelligence with comprehensive, accurate, up-to-date, import and export information.
Our multinational trade data assets can be used to trace global supply chains and our bill-of-lading trade data – with cross-references to company profiles and customs information – can help businesses identify and qualify new sources. Ask us for a free, no obligation demonstration of our data on a product or trade commodity of your choosing – and keep the custom research we create with our compliments.