The Global Shipping Report
February U.S. Container Imports Continue Strong Performance Amid Trade Tensions
In February 2025, U.S. container imports declined 10% from January, but increased by 4.7% compared to the same month last year. Month-over-month results were expected to be smaller as February was a shorter month by three business days this year and because of the long-standing seasonal decline in container imports from January to February. At 2,238,942 twenty-foot equivalent units (TEUs), however, February 2025 posted the second-highest volume for the month, trailing February 2022 by just 73,341 TEUs.
February imports from China saw a notable decline of 12.5% from January, reaching 872,779 TEUs. This decline may be due to the Chinese Lunar New Year (January 29 – February 12) and fewer business days in the month, in addition to the implementation of a 10% tariff by the U.S. on Chinese imports which went into effect on February 4. Year-over-year, however, volumes from China increased by 7.9% from February 2024, reflecting the continuing demand for Chinese imports. The implementation of a new, additional 10% tariff imposed on March 4, on top of February’s 10% tariff, may create additional volatility for Chinese imports in the months ahead.
Descartes’ March logistics update reports strong performance, even with a typical seasonal softening of U.S. container imports in February 2025 compared to January. The update also highlights the volatility associated with evolving tariff and trade policies on global supply chains. Additionally, potential peace negotiations between Ukraine and Russia, coupled with ongoing geopolitical instability in the Middle East, further complicate the situation. The growing complexity of the global trade landscape suggests supply chain disruptions in the months ahead, creating significant challenges for businesses navigating this unpredictable environment.
In this Article...
- toc
U.S. container imports remain strong even with traditional seasonal decline.
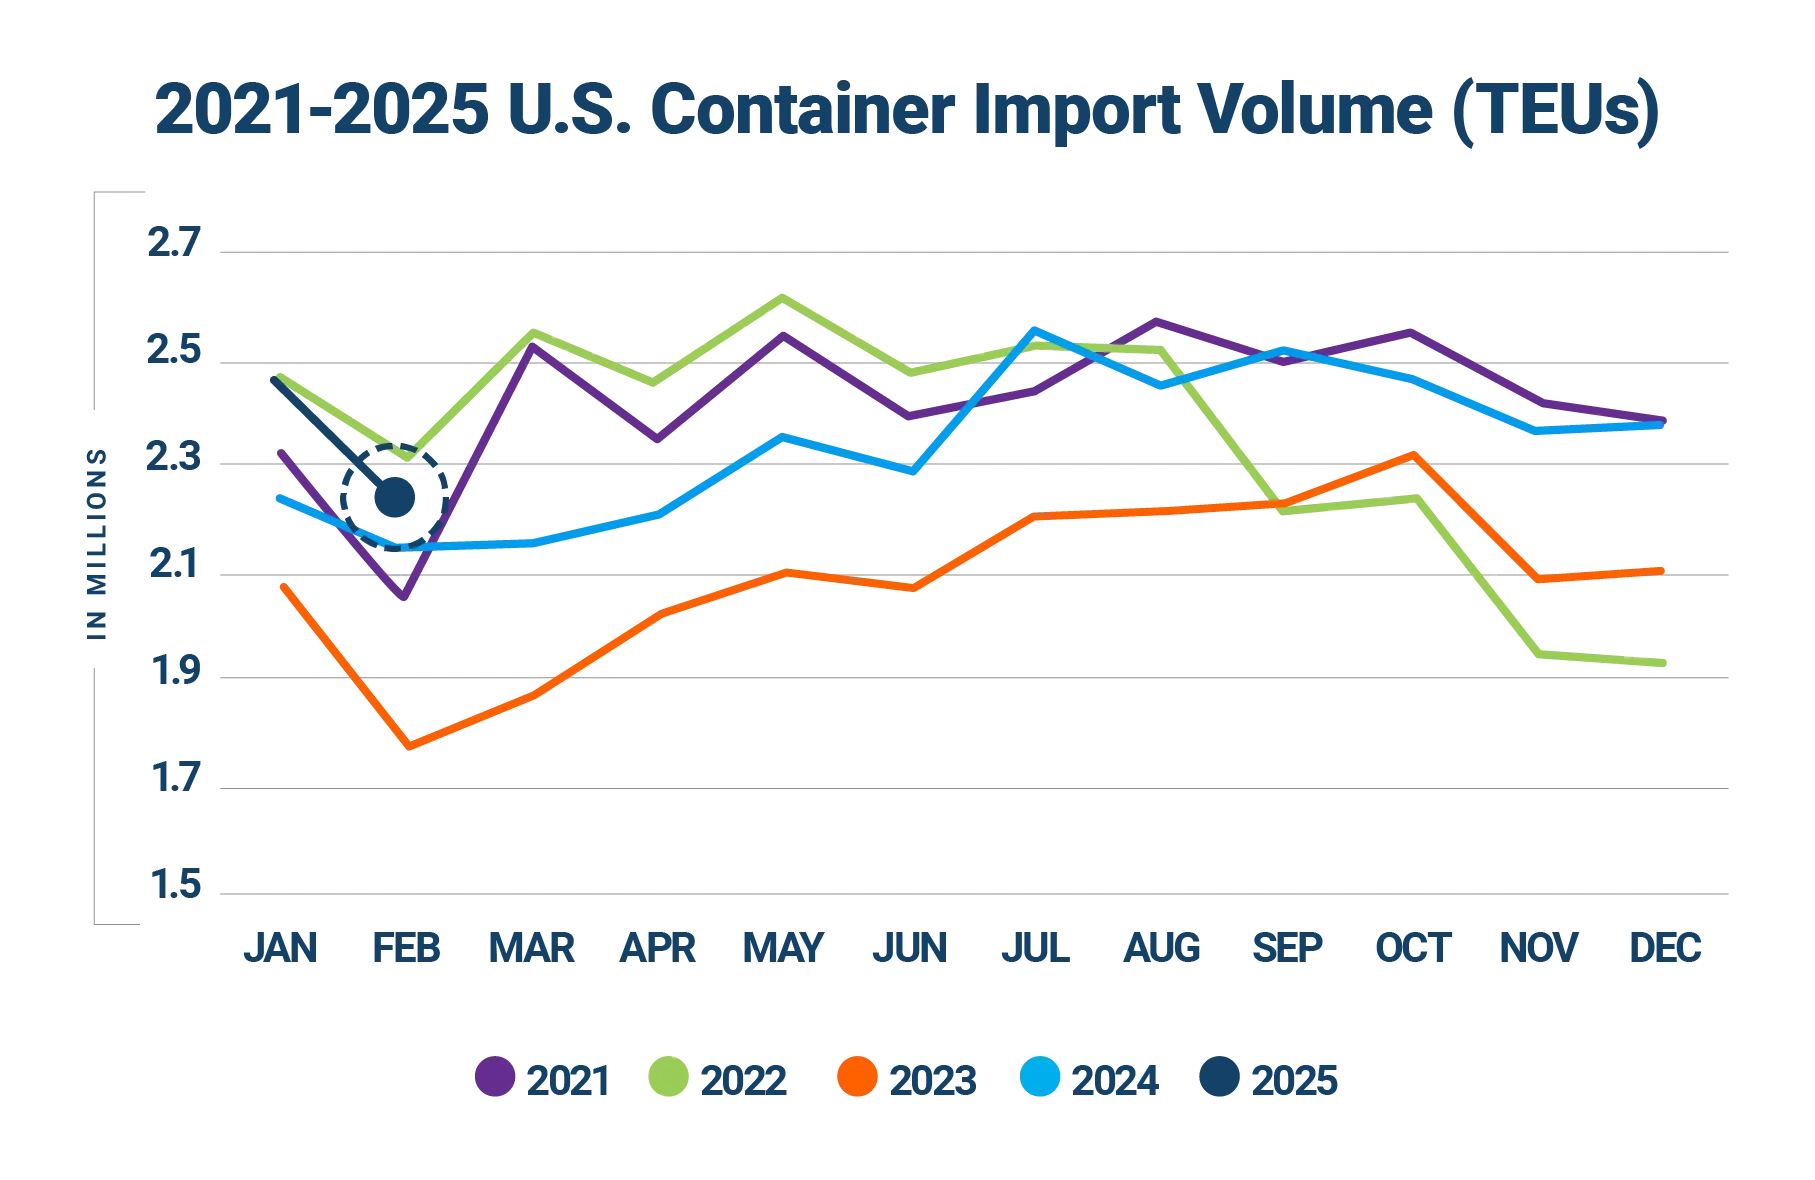
In February 2025, U.S. container import volumes totaled 2,238,942 TEUs, decreasing by 10% over January. (see Figure 1). Compared to February 2024, February 2025 imports increased by 4.7%, indicating continued strength in imports at the start of the year.
Figure 1: U.S. Container Import Volume Year-over-Year Comparison
Source: Descartes Datamyne™
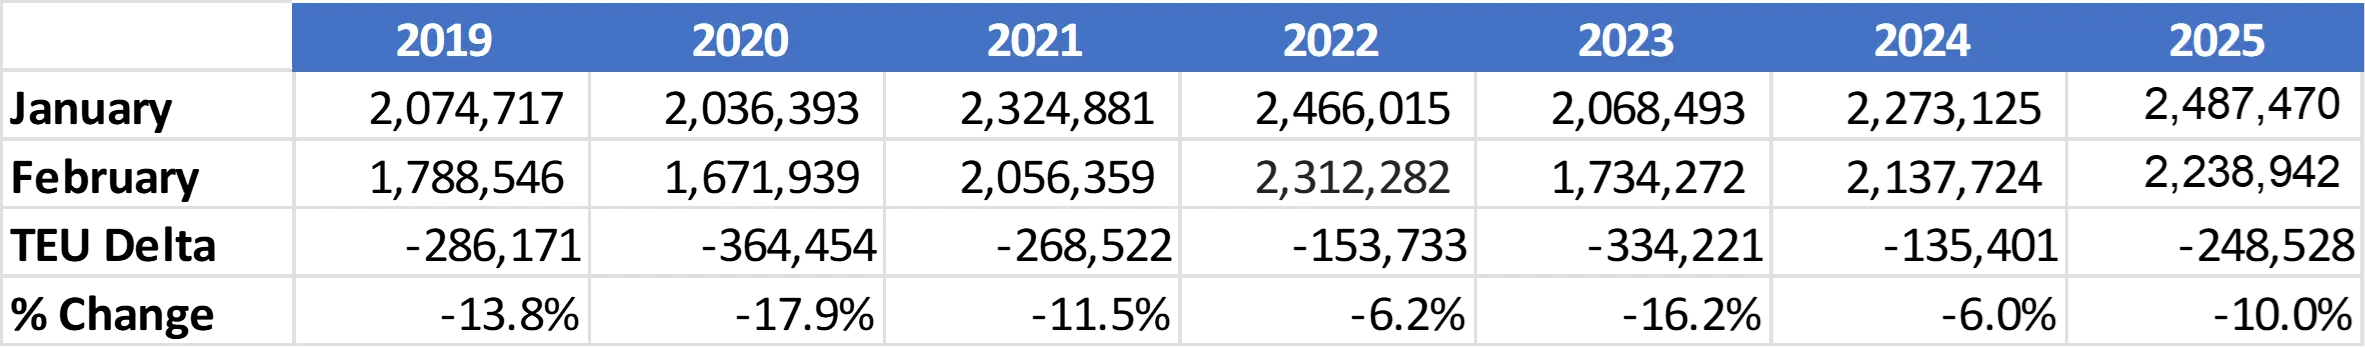
February's import volume was the second highest for the month, trailing February 2022 by just 73,341 TEUs (see Figure 2). The January–February 2025 decline of 248,528 TEUs is closely aligned with the average seasonal month-over-month decrease of 251,266 TEUs observed from 2020 to 2024.
Figure 2: January to February U.S. Container Import Volume Comparison
Source: Descartes Datamyne™
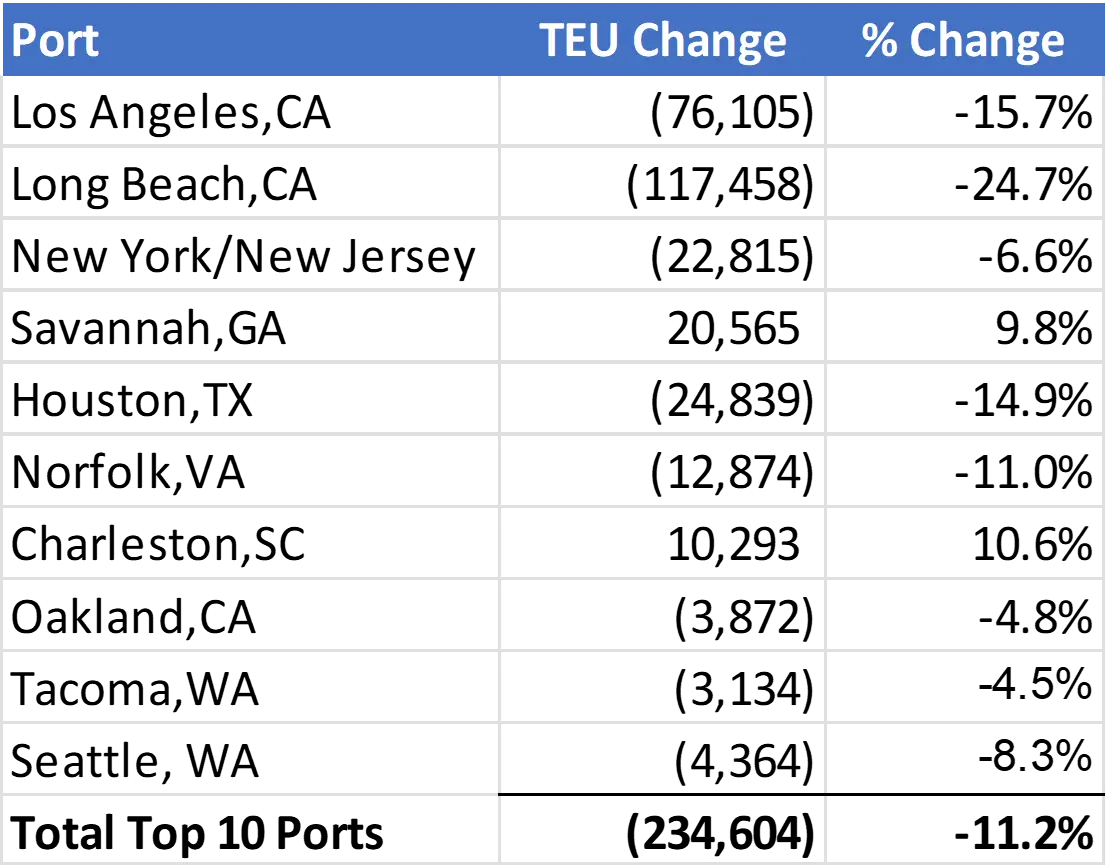
In February 2025, container import volumes at the top 10 U.S. ports dropped by 234,604 TEUs, reflecting an 11.2% decline from January 2025 (see Figure 3). Only two ports saw volume increases: Savannah (up 9.8%) and Charleston (up 10.6%). The remaining ports experienced declines, with the largest reductions at Long Beach (down 24.7%), Los Angeles (down 15.7%), Houston (down 14.9%), and Norfolk (down 11.0%).
Figure 3: January 2025 to February 2025 Comparison of Import Volumes at Top 10 U.S. Ports
Source: Descartes Datamyne™
U.S. imports from China decline in February 2025 but grow year-over-year.
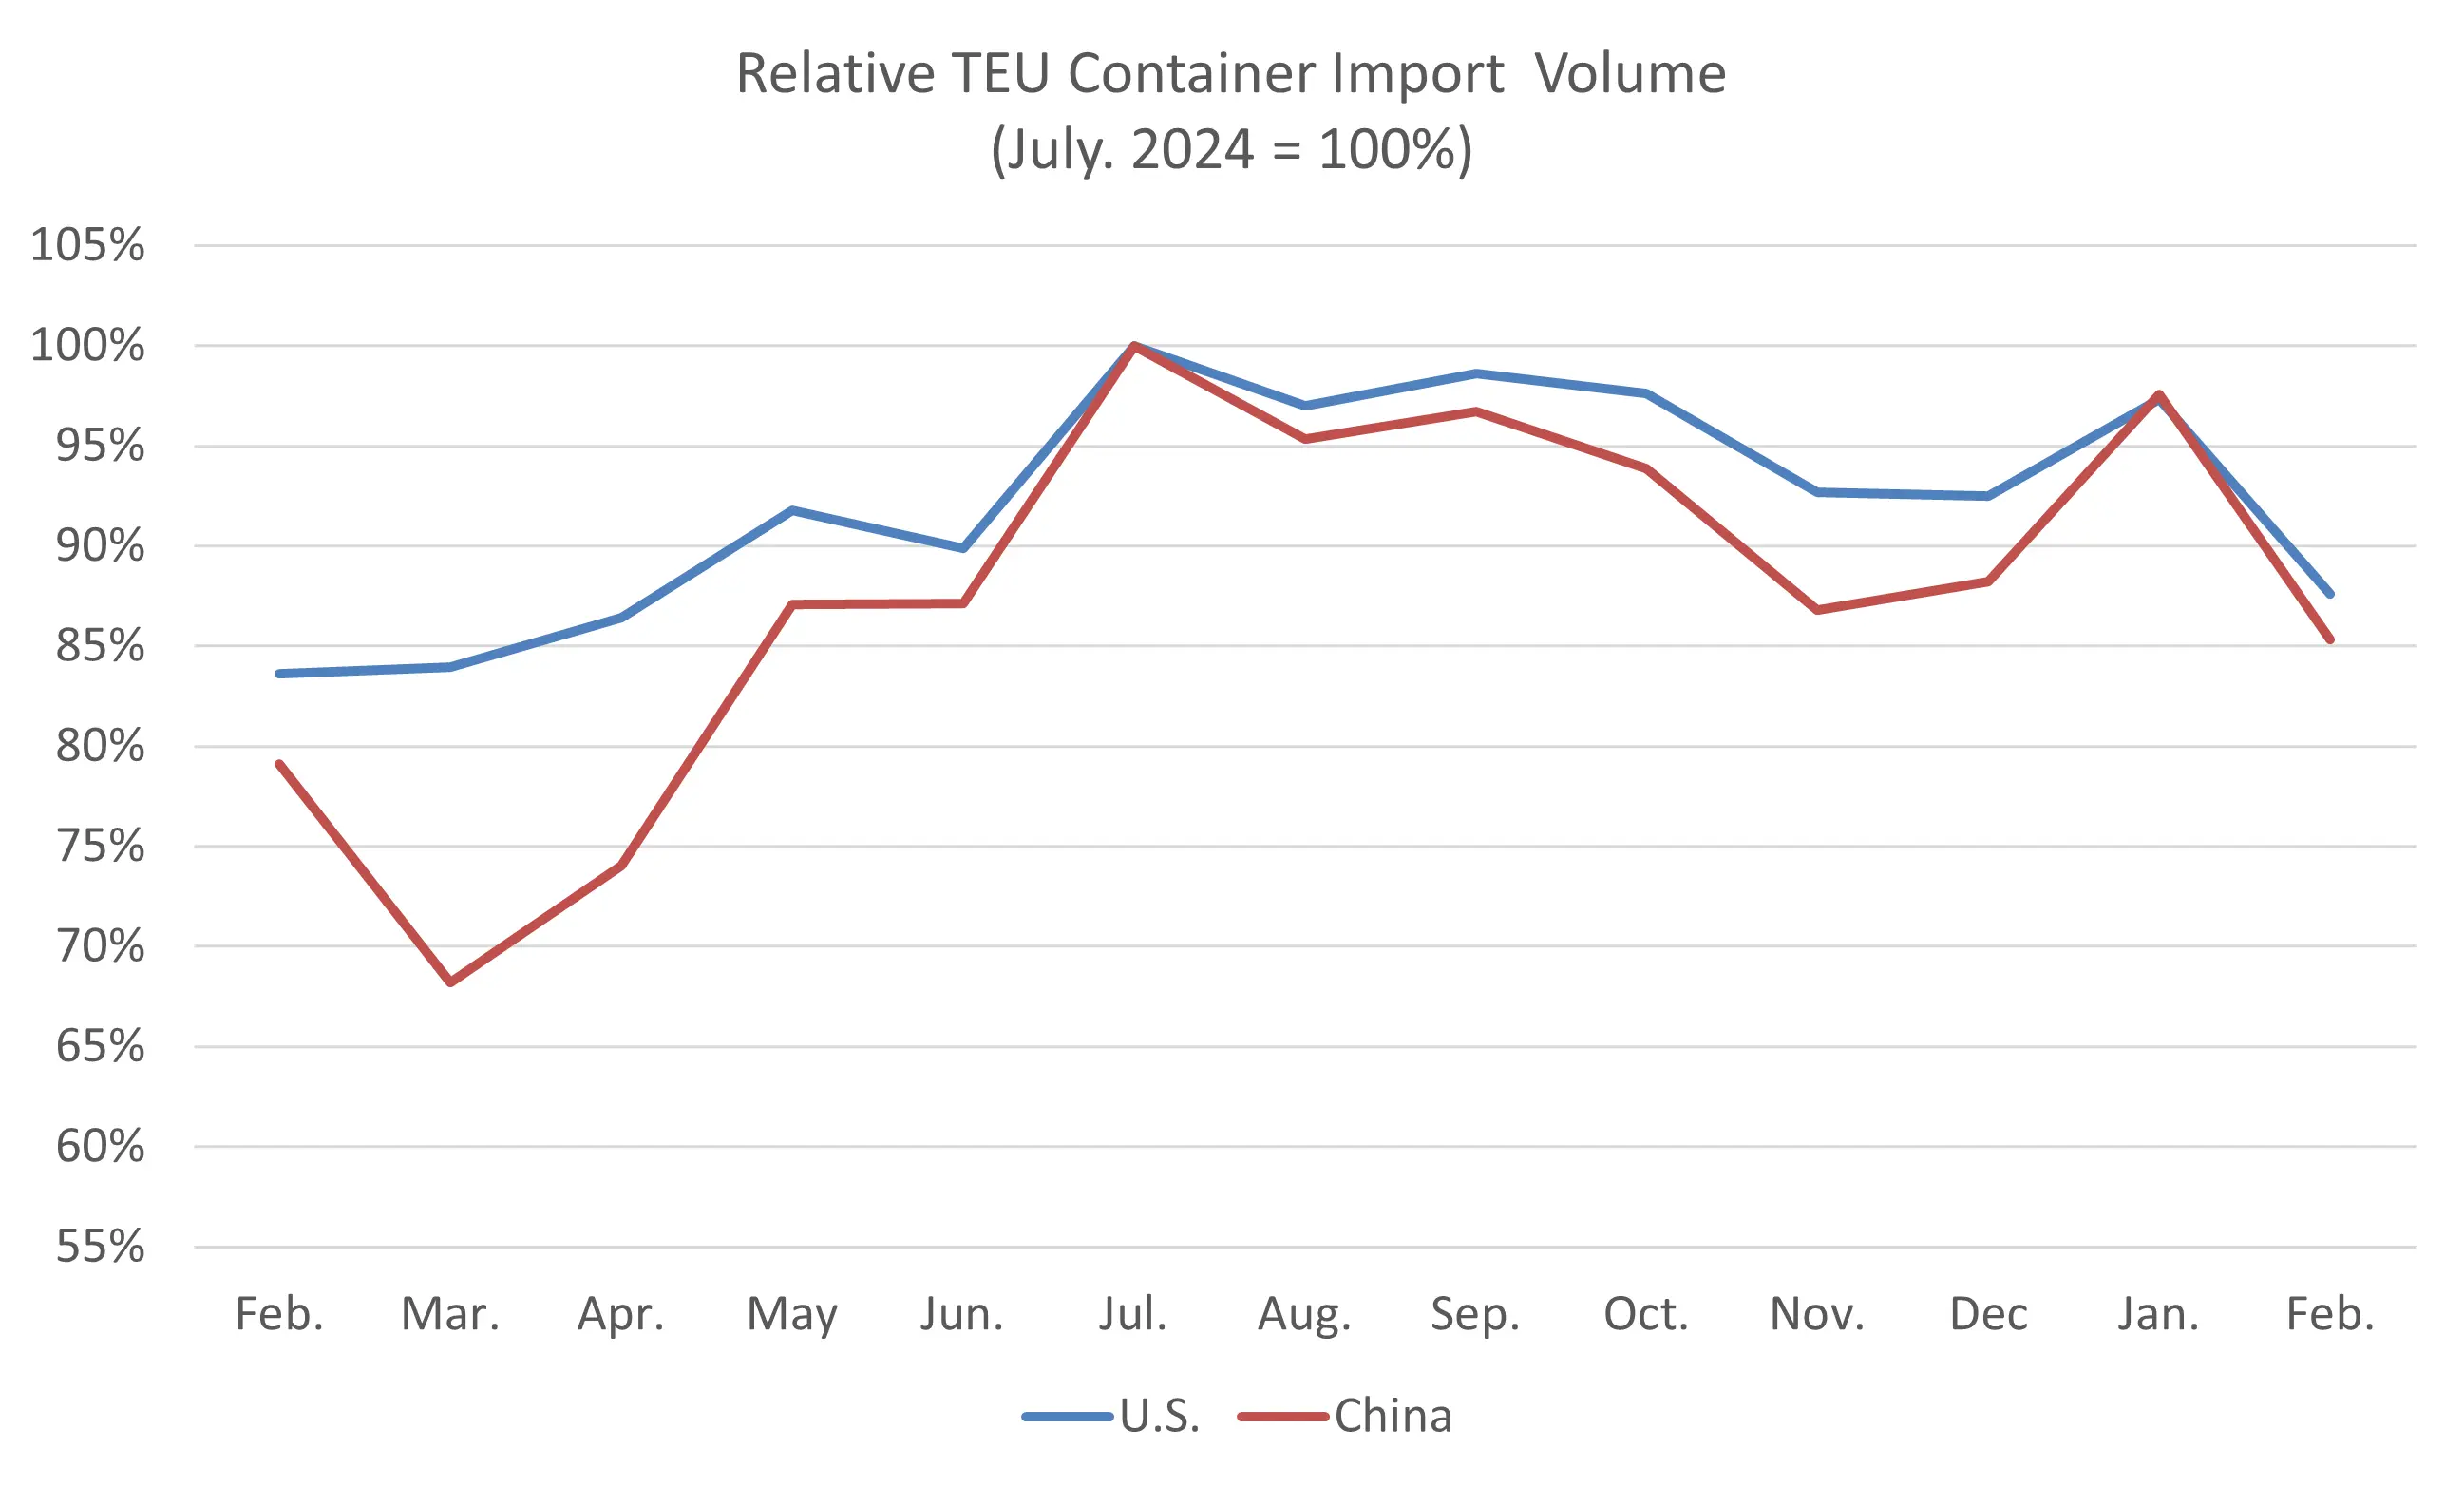
In February 2025, U.S. import volume from China dropped 12.5% (872,779 TEUs) compared to January (997,909 TEUs). In 2024, Chinese imports declined 10.6% in the same month-over-month period. A seasonal month-over-month decline in Chinese imports is also typical and is not necessarily exclusively indicative of the impact of the new 10% U.S. tariff that took effect in February. Additionally, volumes may have been affected by the Chinese Lunar New Year, which took place from January 29 to February 12, and February being a shorter month. On a year-over-year basis, however, February imports from China were up 7.9%, potentially driven in part by U.S. importers preparing for tariffs. The top three commodity categories (HS-2 codes) for Chinese imports were HS-94 (Furniture, Bedding, etc.), HS-39 (Plastics and Articles Thereof), and HS-84 (Nuclear Reactors, Boilers, Machinery, etc.). China represented 39.0% of total U.S. container imports in February, a slight 1.1% decrease from January and just 2.5% lower than the February 2022 peak of 41.5%.
Figure 4: February 2024–February 2025 Comparison of U.S. Total and Chinese TEU Container Volume Relative to Chinese Import Record
Source: Descartes Datamyne
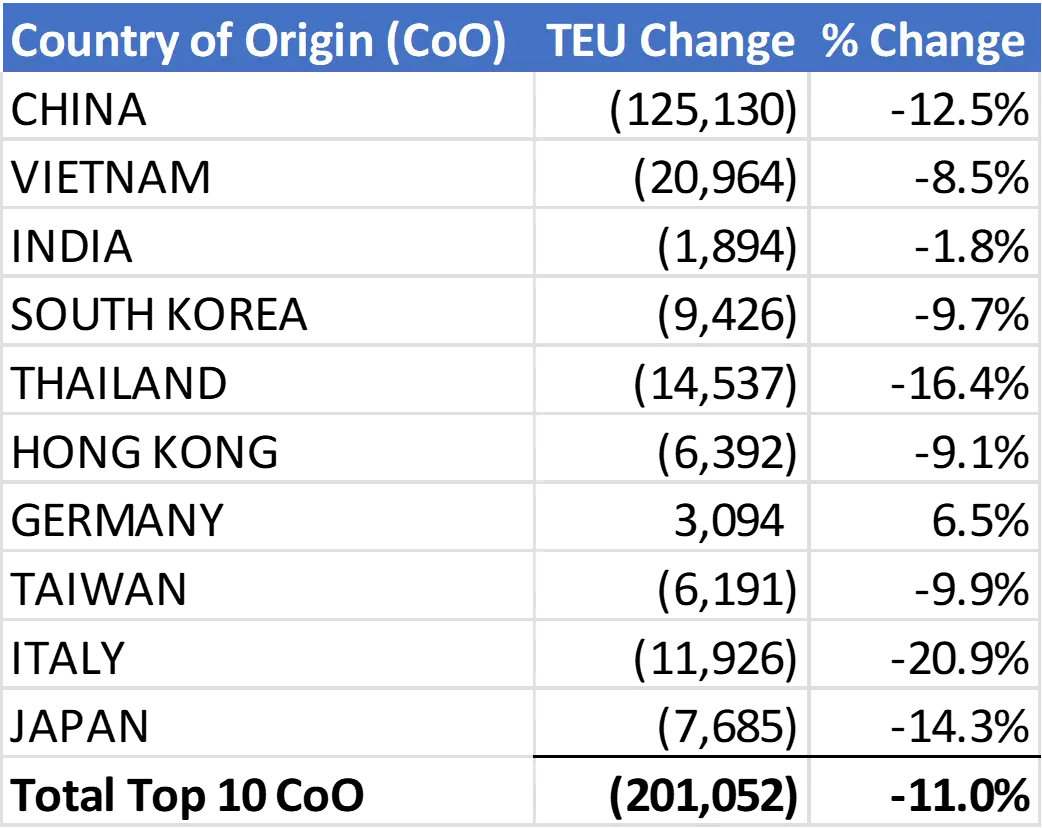
In February 2025, U.S. container import volume from the top 10 countries of origin (CoO) fell by 201,052 TEUs, a decline of 11.0% compared to January (see Figure 5). Among these countries, China saw the largest drop, down 125,130 TEUs, followed by Vietnam (down 20,964 TEUs), Thailand (down 14,537 TEUs), and Italy (down 11,926 TEUs). The only country in the top 10 to experience an increase was Germany, with a 6.5% gain of 3,094 TEUs.
Figure 5: January 2024 to February 2025 Comparison of U.S. Import Volumes from Top 10 Countries of Origin
Source: Descartes Datamyne
West Coast ports maintain dominant market share, though gap narrows.
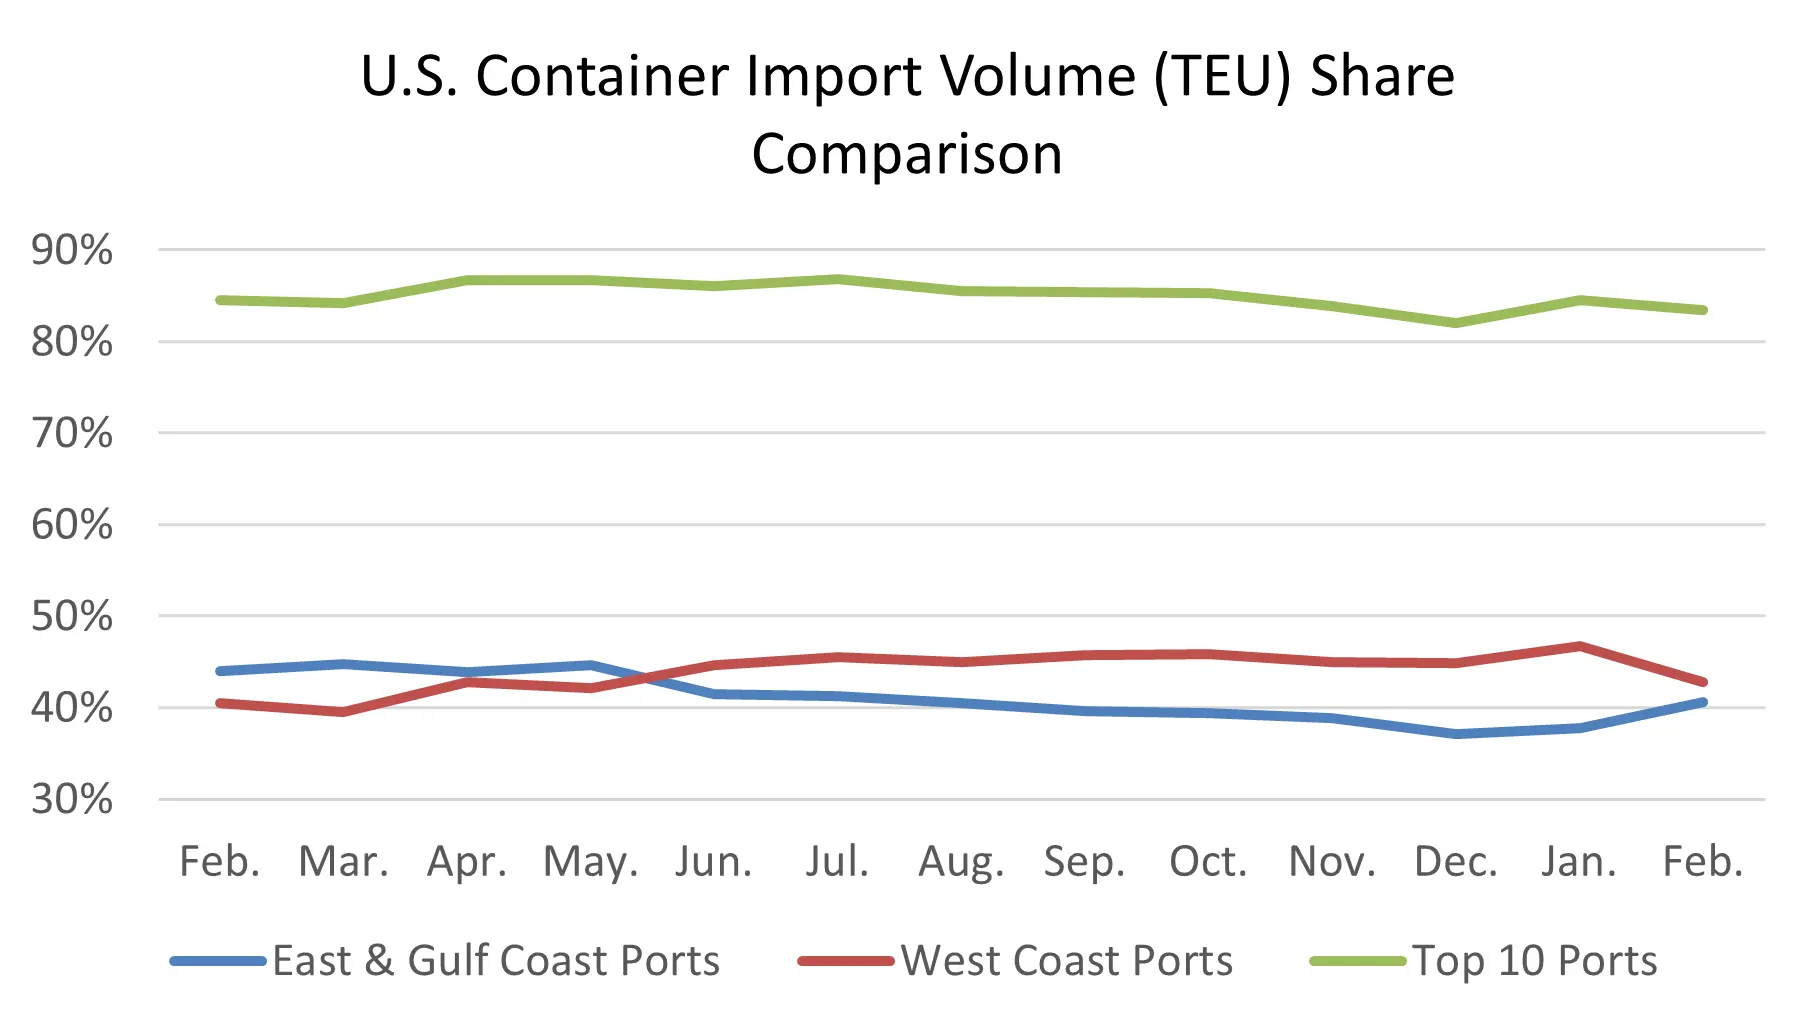
For the ninth consecutive month, the top five West Coast ports maintained their dominance in U.S. container imports, although the gap with East and Gulf Coast ports is shrinking. In February, East and Gulf Coast ports saw a 2.9% increase in market share, rising from 37.7% to 40.6%, while the West Coast's share declined by 4.0%, from 46.8% to 42.8% (see Figure 6). The overall market dominance of the top 10 ports also weakened in February, dropping from 84.5% to 83.4% of total U.S. imports. This shift may reflect, in part, the Chinese Lunar New Year in the first half of February and the February 10% tariff on China.
Figure 6: Volume Analysis for Top Ports, West Coast Ports and East and Gulf Coast Ports
Source: Descartes Datamyne
With a 20% tariff now in effect on U.S. imports from China, however, we may see greater month-over-month fluctuations in market share between top West Coast ports and top East and Gulf Coast ports.
Marginal changes to port delays across West, East, and Gulf Coast ports.
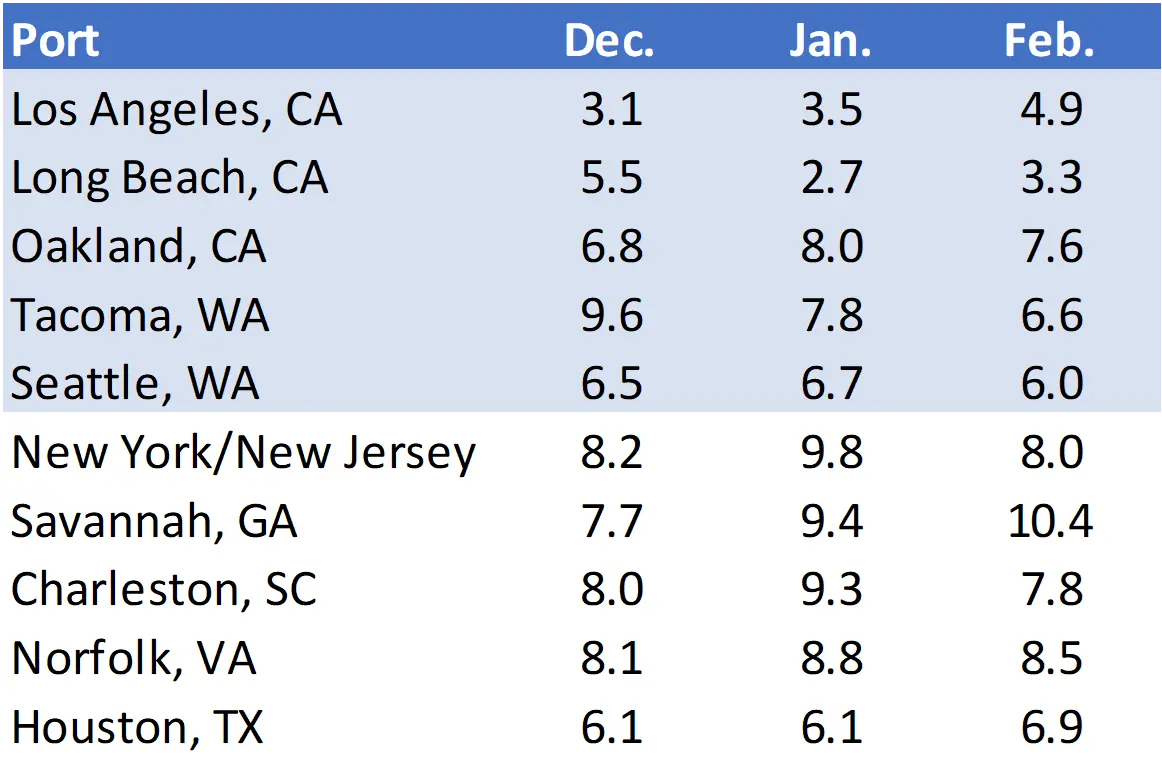
Overall, port transit time delays across the top 10 U.S. ports in February over January remained largely unchanged with marginal increases and decreases in delays (see Figure 7). The largest improvements were at New York where delays were reduced by 1.8 days, Charleston (1.5 days), and Tacoma (1.2 days). The largest increase in delays was at Los Angeles where delays increased by 1.4 days.
Figure 7: Monthly Average Transit Delays (in days) for the Top 10 Ports (Dec. 2024 – Feb. 2025)
Source: Descartes Datamyne™
Note: Descartes’ definition of port transit delay is the difference as measured in days between the Estimated Arrival Date, which is initially declared on the bill of lading, and the date when Descartes receives the CBP-processed bill of lading data.
Gulf Coast imports hit lowest level since November 2023.
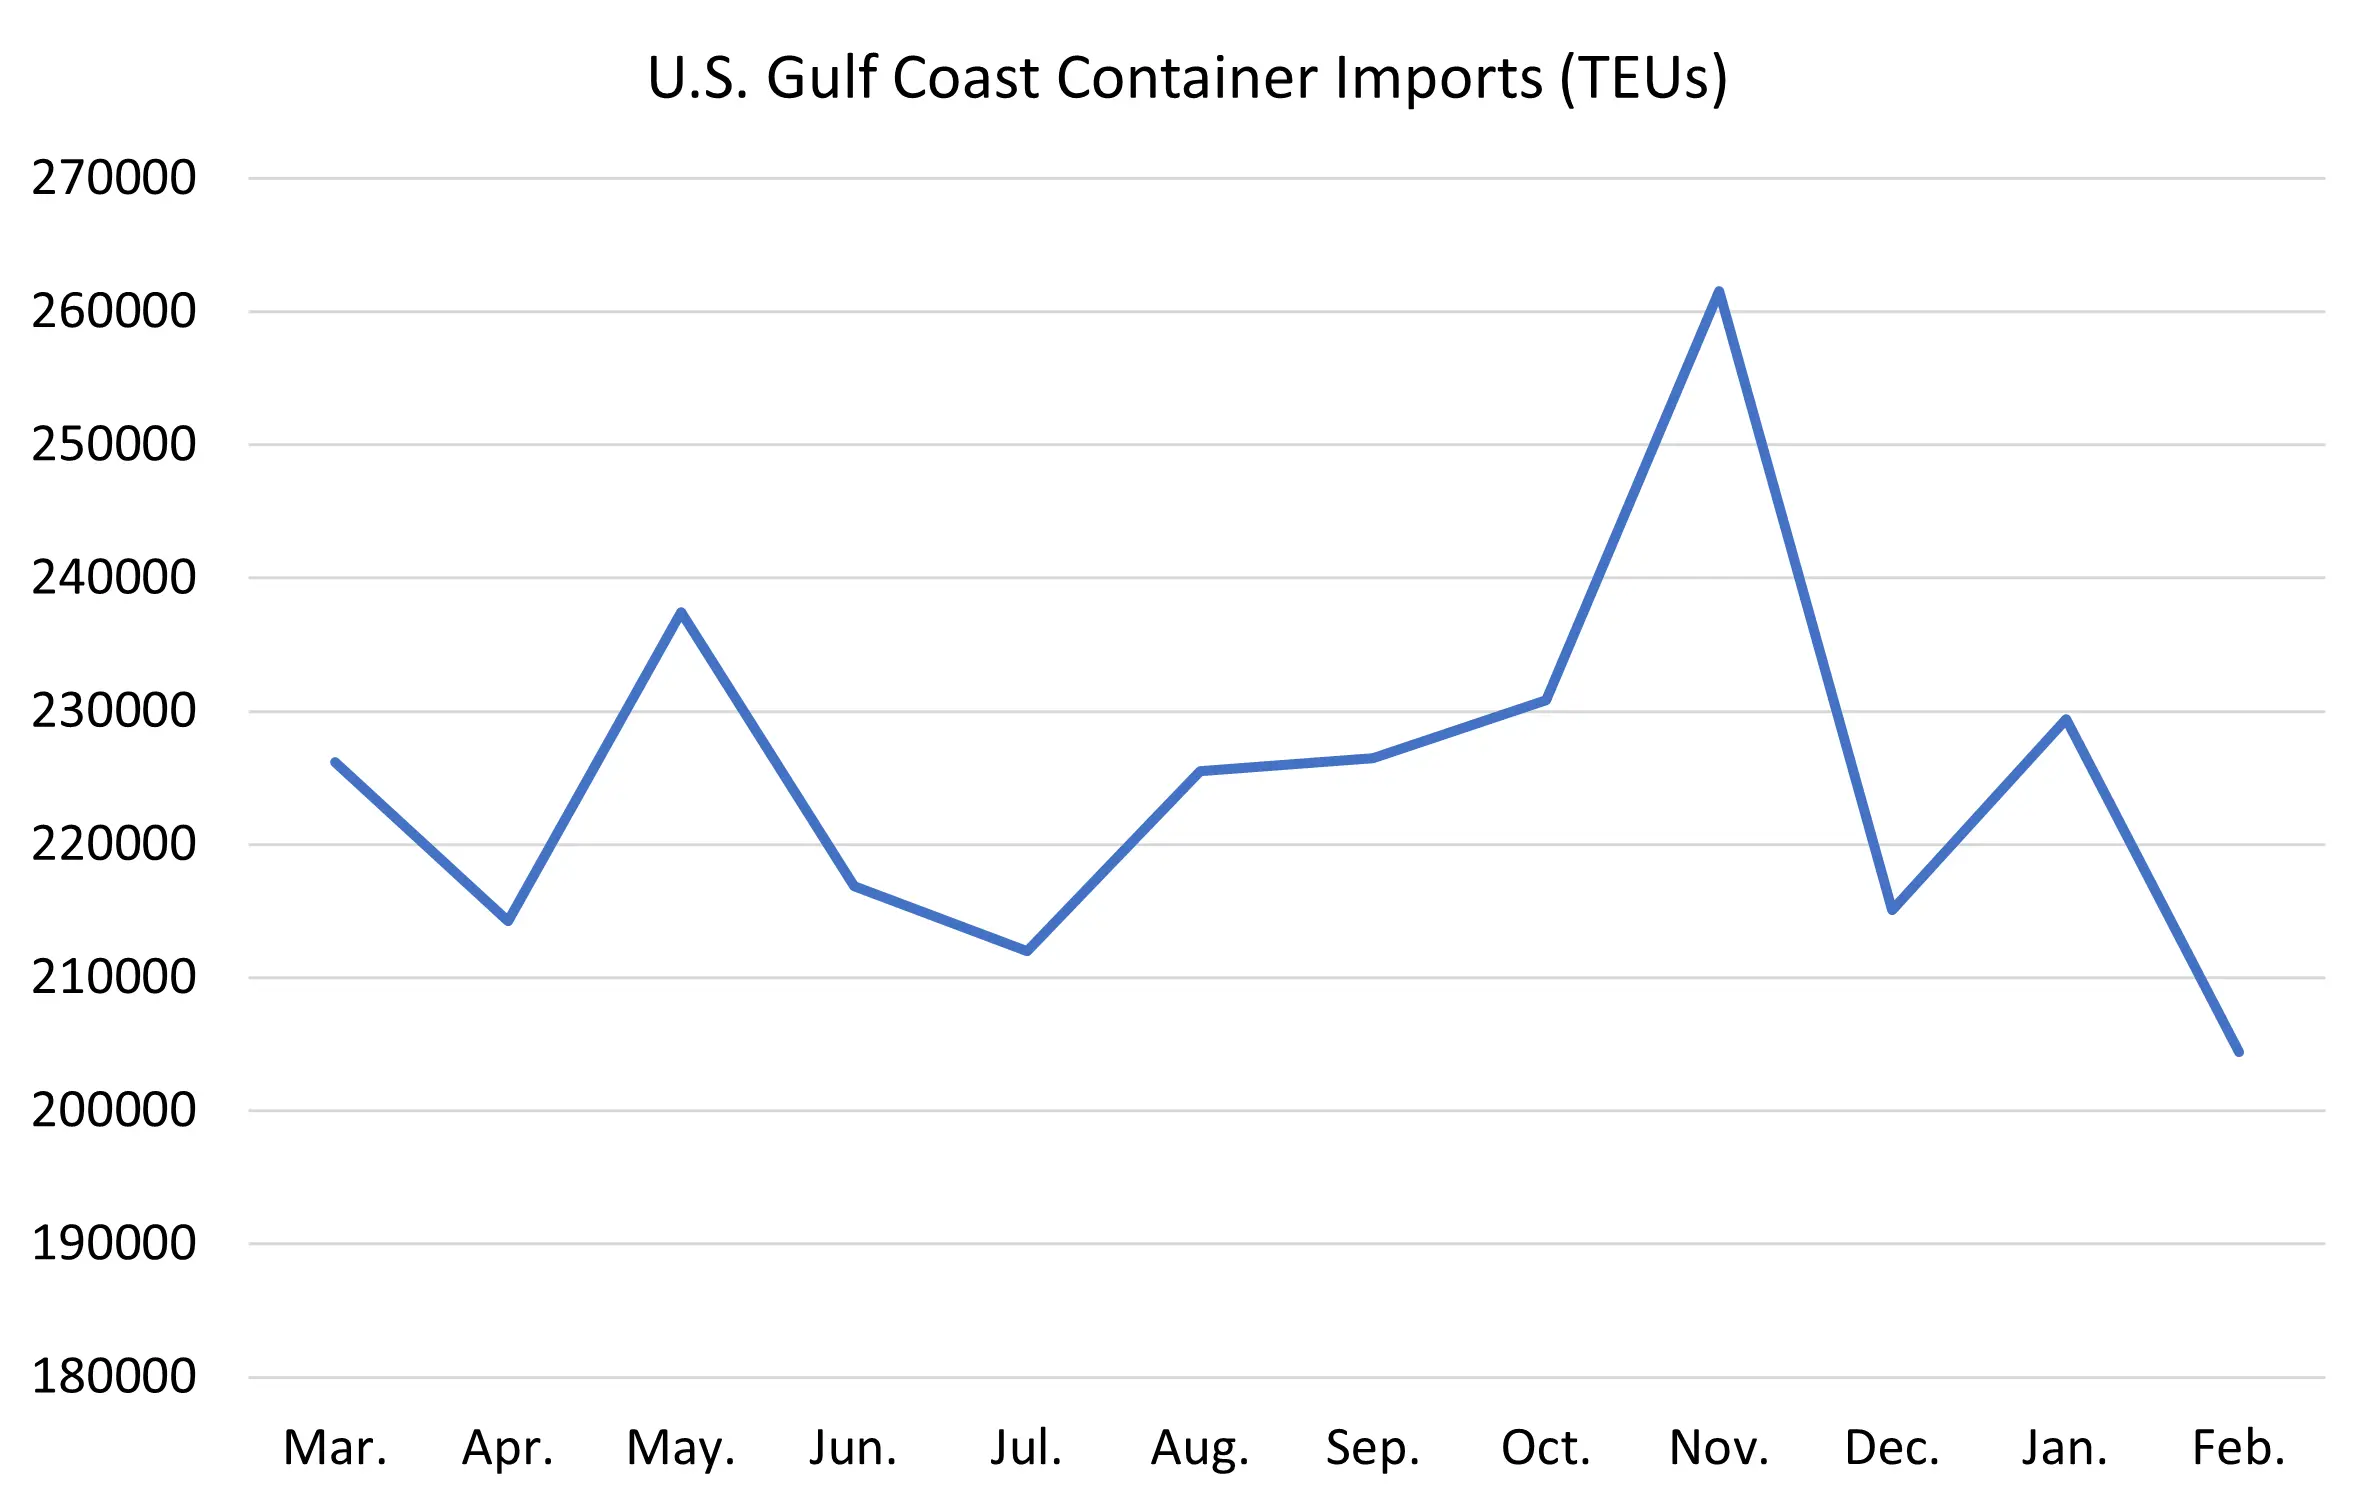
February 2025 Gulf Coast imports (204,421 TEUs) decreased by 10.9% from January (229,403 TEUs), reaching their lowest level since November 2023 (189,491 TEUs) and falling 9.9% below the 12-month average (226,785 TEUs) (see Figure 8). Despite the significant decline in import volumes, port transit times at Gulf Coast ports extended in February, with overall delays increasing by approximately 16%.
Figure 8: March 2024 to February 2025 U.S. Gulf Coast Container Imports
Source: Descartes Datamyne™
Rising trade tensions and tariffs threaten trade and economic stability.
On February 4, the U.S. imposed a 10% tariff on Chinese imports, which was followed by an additional 10% tariff on March 4. While trade negotiations with Mexico and Canada were extended through February, 25% tariffs were applied to U.S. imports on goods from both countries on March 4. On March 6, however, it was announced that Mexico and Canada tariffs were delayed until April 2. These developments create significant uncertainty in global trade, raising concerns about rising import costs, supply chain disruptions, and economic instability. As tensions escalate, businesses and consumers may face higher prices and prolonged market volatility, with the potential risk of an economic recession due to the aggressive tariff policies.
Red Sea shipping stalled despite ceasefire amid ongoing geopolitical risks.
Despite a Houthi-declared ceasefire, Red Sea shipping remains stalled as geopolitical risks persist, deterring companies from resuming transit. No new attacks have been reported, but the region's instability continues to disrupt global trade, raising costs and uncertainty. Experts warn that the ceasefire is fragile and directly tied to the Gaza truce, meaning shipping risks could quickly return if hostilities resume.

Director, Industry Strategy, Global Trade Intelligence, Descartes

The Must-Read Guide on U.S. Maritime Ports

Gain deep insights into 2023 U.S. imports and learn how to mitigate risks in your supply chain.
Stay Informed. Download the Report.
How Descartes Can Help
Descartes Datamyne delivers business intelligence with comprehensive, accurate, up-to-date, import and export information.
Our multinational trade data assets can be used to trace global supply chains and our bill-of-lading trade data – with cross-references to company profiles and customs information – can help businesses identify and qualify new sources. Ask us for a free, no obligation demonstration of our data on a product or trade commodity of your choosing – and keep the custom research we create with our compliments.