The latest Descartes Datamyne™ U.S. import data indicates yet another reordering of traditional trade patterns as businesses stockpiled, and trading partners raced to get exports to market ahead of rising tariffs, quotas, and export restrictions —particularly in response to shifting policies on China imports.
Key Takeaways
- Businesses rushed shipments ahead of rising U.S. tariffs, driving a spike in import volumes early in 2025.
- The U.S. monthly deficit dropped 55% from March to April due to importers frontloading shipments—with China imports playing a major role in the surge.
- Traditional peak shipping periods have been upended by recurring trade and geopolitical disruptions.
- China imports surged through April, then dropped sharply in May under new tariff pressures.
- Less-than-container-load (LCL) shipments increased, especially from China, as companies tried to minimize tariff exposure—a notable shift in China import strategies.
- Long Beach saw record shipment volumes and rose in ranking due to the small-shipment surge, largely driven by increased China imports.
- Shifting tariffs, suspended policies, and the evolving de minimis exemption continue to reshape trade flows—most visibly in China import behavior.
- Descartes Datamyne’s bill-of-lading (BOL) data offers visibility into changing trade patterns and shipment-level details, with China imports providing critical insights.
The new U.S. tariff regime has achieved one policy objective: On June 5th, the Commerce Department announced a 55% reduction in the U.S. trade deficit from March’s $138.3 billion to April’s $61.6 billion. This April’s deficit was also 16% lower than the April ’24 deficit of $73.1 billion—driven in part by the steep decline in China imports.
Figure 1 U.S. Trade Deficit Narrows in April
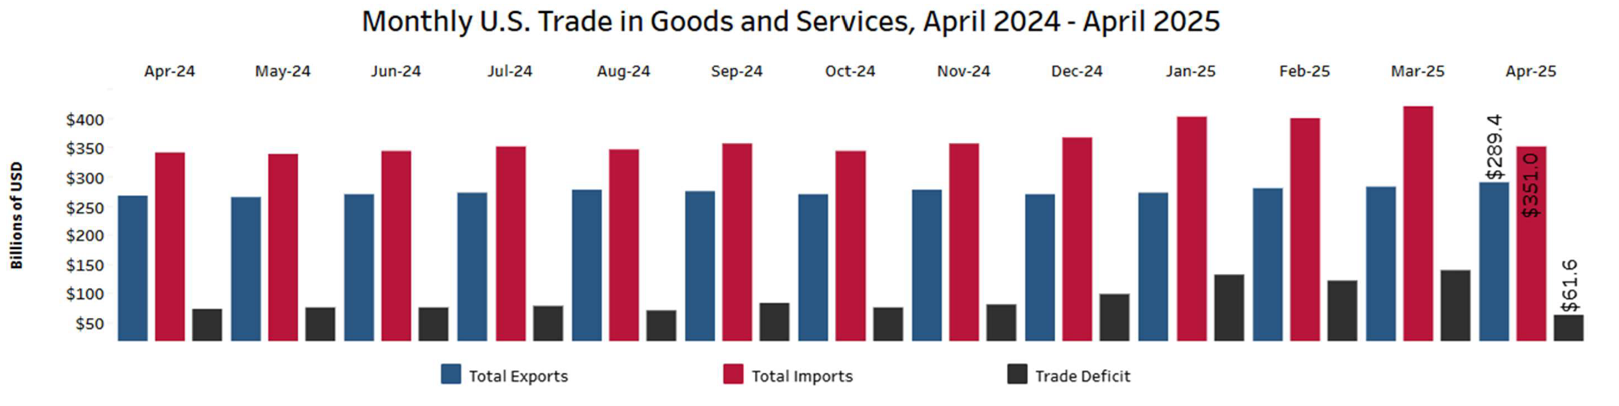
Source: U.S. Dept. of Commerce
It should be noted that the deficit in March 2025 was almost double that of March 2024, following an unseasonable run-up in imports that began as early as November 2024, with China imports at the forefront of this buildup.
Figure 2 The Rise and Fall of the U.S. Trade Deficit
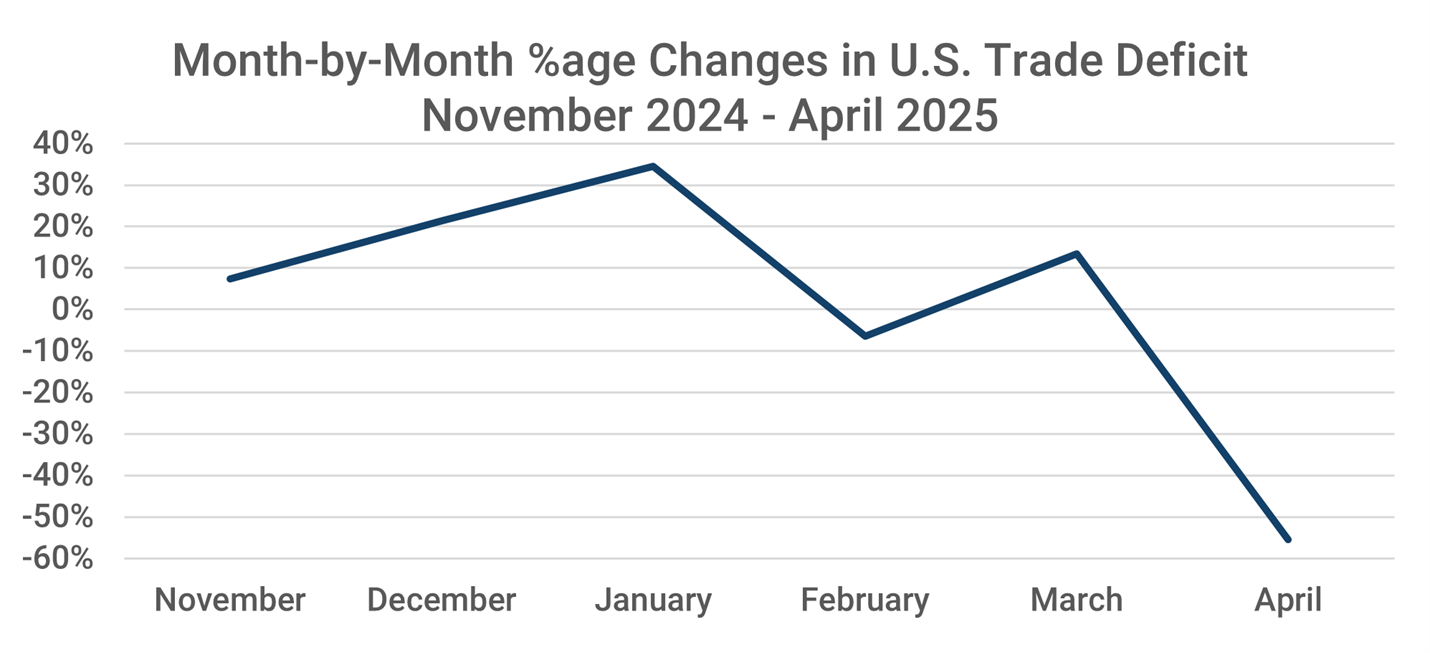
Source: U.S. Dept. of Commerce
U.S. Waterborne Import Volumes Surge
While the most recent data shows the value of U.S. imports has come down and the trade gap narrowed, the volume of imports increased in the months before stiff import duties were scheduled to take effect—a pattern largely shaped by accelerated China imports.
Descartes Datamyne bill-of-lading import data captures the effect of this surge on maritime import volumes (measured in 20-foot-equivalent units, or TEUs), which hit their 2025 year-to-date peak in January, before a March-April climb that ended in a precipitous fall in May—particularly for China imports.
Figure 3 Peak Shipping Seasons in U.S. Imports 2021 through May 2025
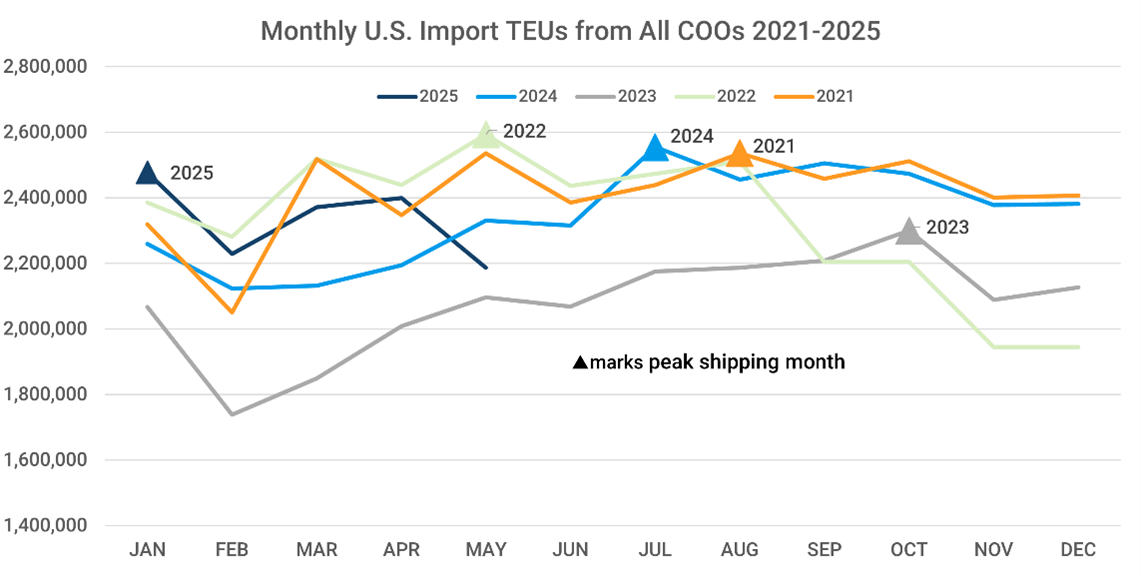
Source: Descartes Datamyne
The data makes clear that the “traditional” peak shipping season, during which retailers stocked up between August and October for end-of-year holiday sales, has not been the norm in 2020s thanks to a succession of black swan events. First came COVID (in 2020); then the post-COVID restocking surge (2021); followed by a shipping congestion crisis (2021 into 2022); then inventory overhang slowing new orders (2023). In recent cycles, China imports have become a key variable in these disruptions.
Since 2024, shifting trade policies have been largely responsible for redirecting trade flows. This is especially true of U.S. policies aimed at reducing reliance on China imports, the top country of origin for U.S. waterborne imports, as the next chart illustrates.
Figure 4 Top Countries of Origin Monthly Import Volumes May 2024 through May 2025
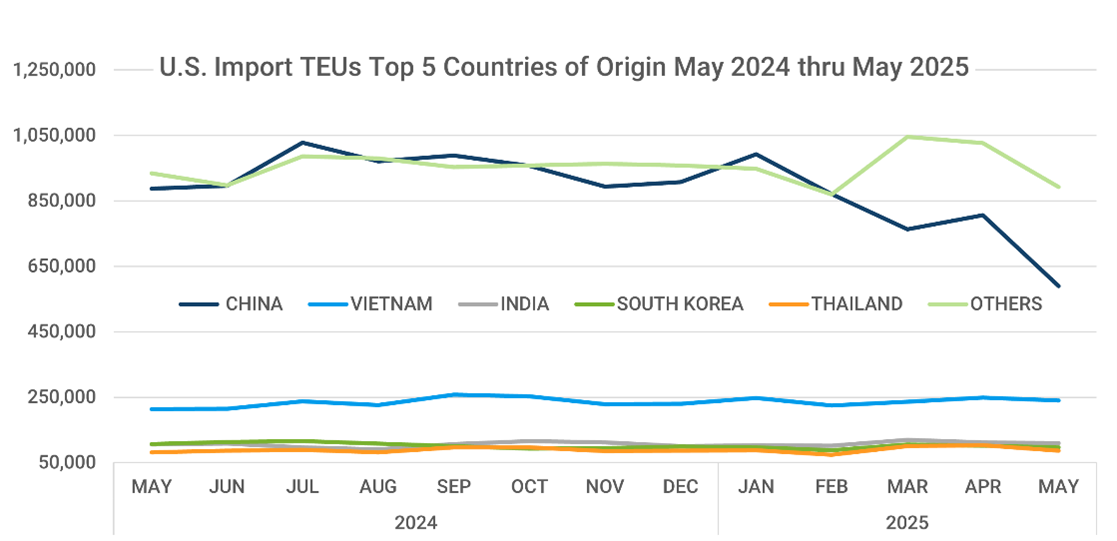
Source: Descartes Datamyne
Note that the Trump administration imposed new 10% tariffs on China imports effective February 4 and again on March 4. Additional tariffs were imposed on steel and aluminum on March 12 and automobiles April 3. “Liberation Day” tariffs aimed at achieving reciprocity in trade partnership were announced April 2nd, with country-specific tariffs (including 34% on Chinese imports) originally set to be applied April 9, but subsequently suspended for 90 days (except for those applied to China). These last tariffs were struck down by the Court of International Trade, a ruling stayed by federal appeals court on May 29; the Supreme Court is expected to settle the fate of these tariffs imposed by executive order.
The cumulative effects of the U.S. tariffs – actual and pending – has taken its toll on inbound shipments. According to a May 6 report from CNN, the first shipments from China subject to the new 145% tariffs arriving at the port of Los Angeles were down by half—a steep collapse in China imports.
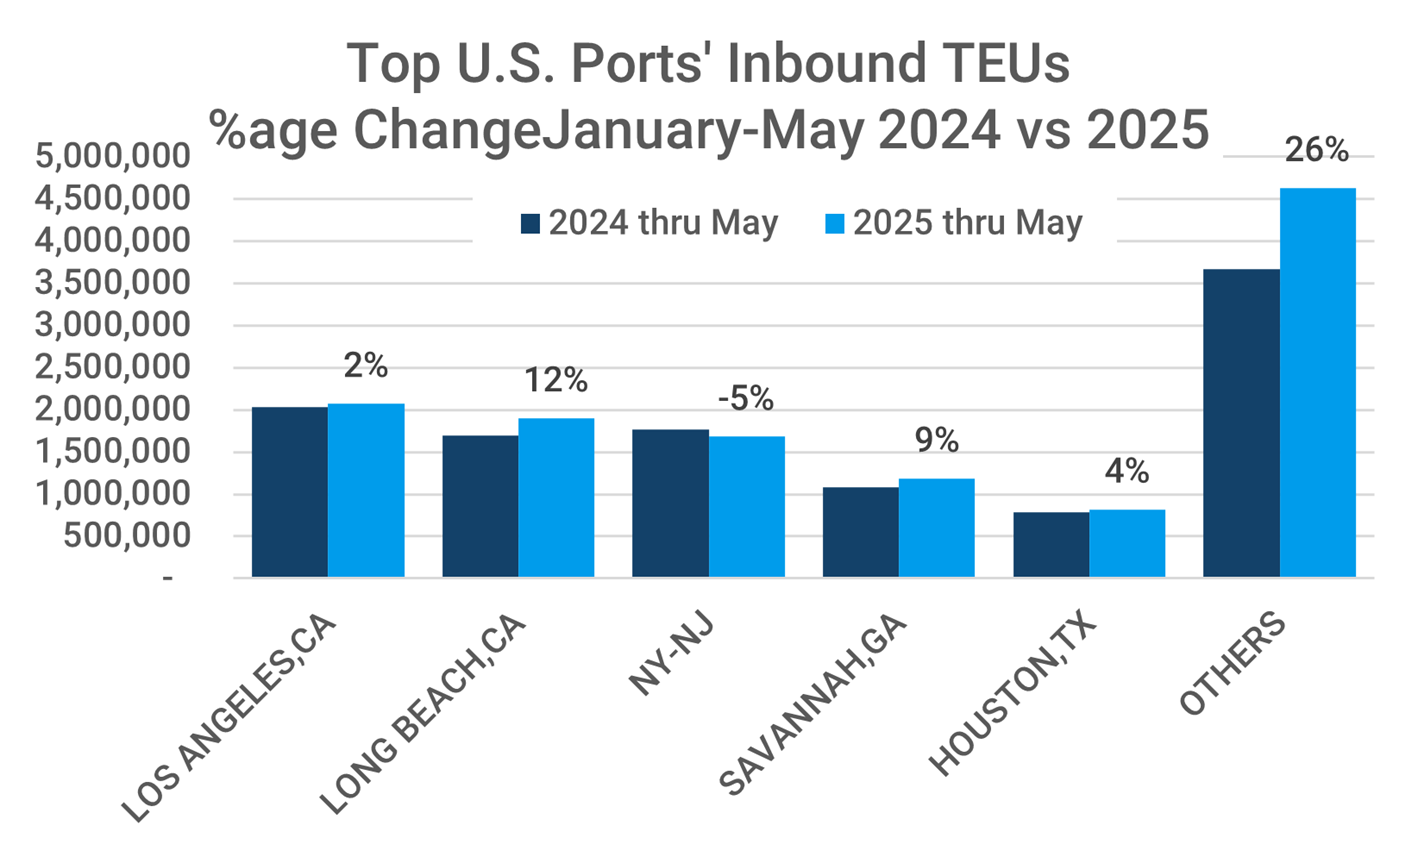
The next chart compares year-to-date changes in inbound TEUs at the top-volume U.S. ports.
Figure 5 Year-over-Year Change in Import Volumes at Top Ports YDT2025
Source: Descartes Datamyne
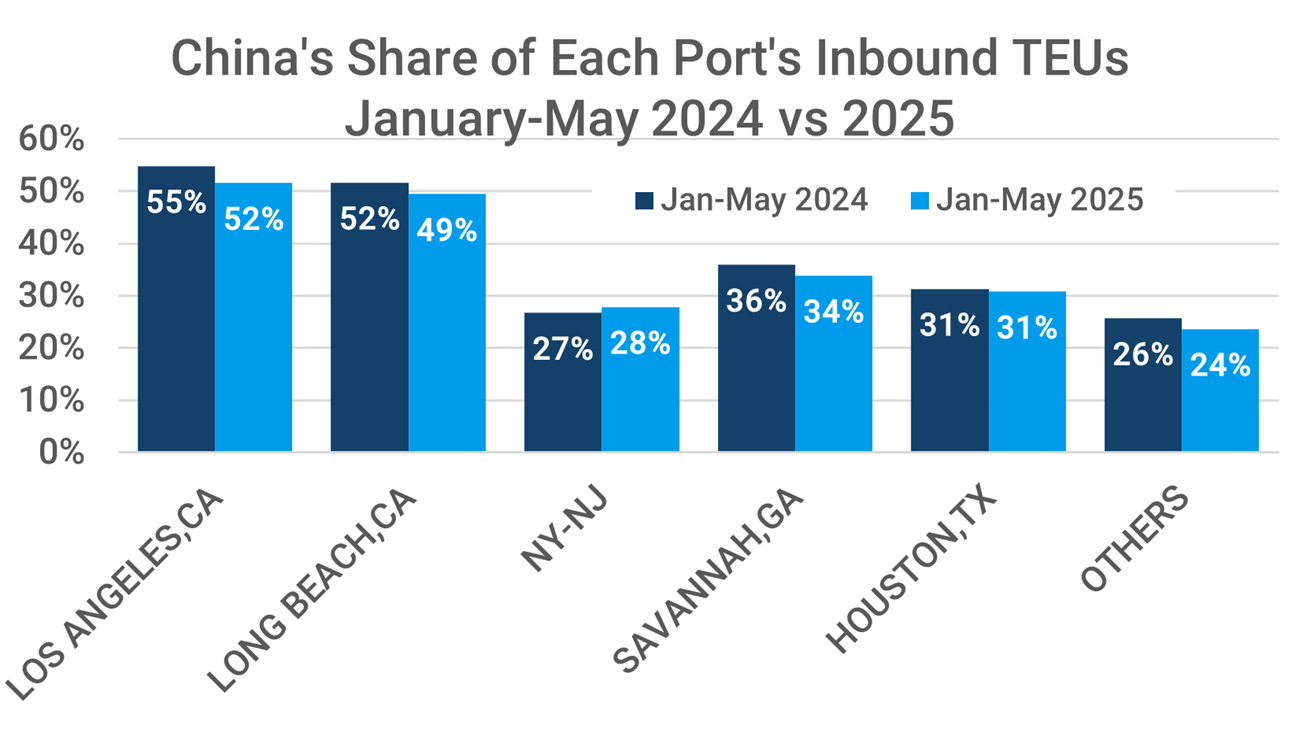
Here’s a comparison of China’s share of imports arriving at each of the top ports year-to-date (YTD) 2025 compared with the same period in 2024:
Figure 6 China's Share of Top U.S. Ports' Imports YTD2025 vs 2024
Source: Descartes Datamyne
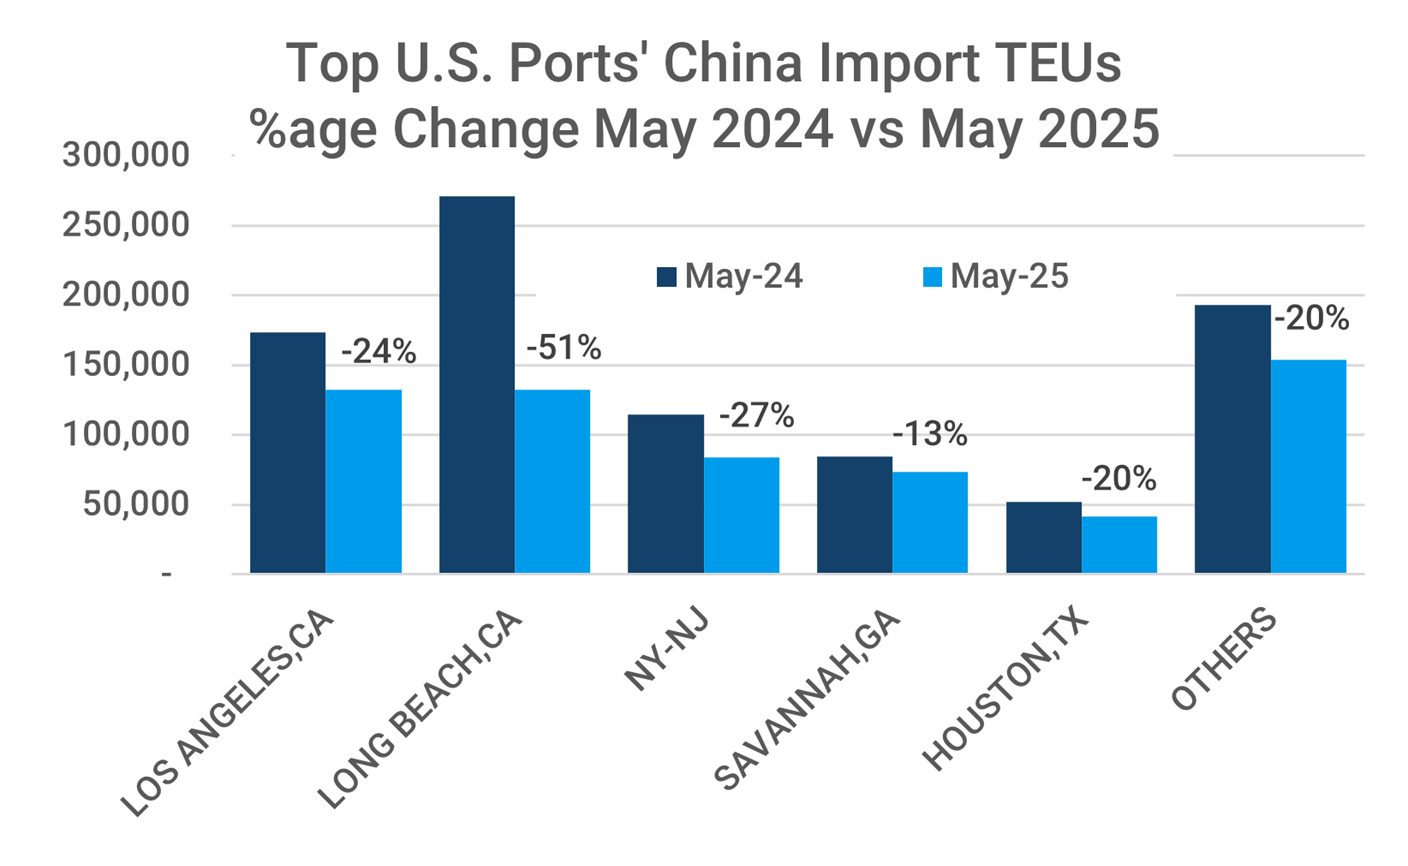
Not surprisingly, the West Coast ports were more reliant on inbound traffic originating in China than the East Coast and Gulf ports. Los Angeles and Long Beach also took the biggest hits when the new tariffs on China imports began to bite in May, as the next chart shows:
Figure 7 Year-over-Year Change in Import Volumes from China at Top Ports YTD 2025
Source: Descartes Datamyne
More records, smaller shipments
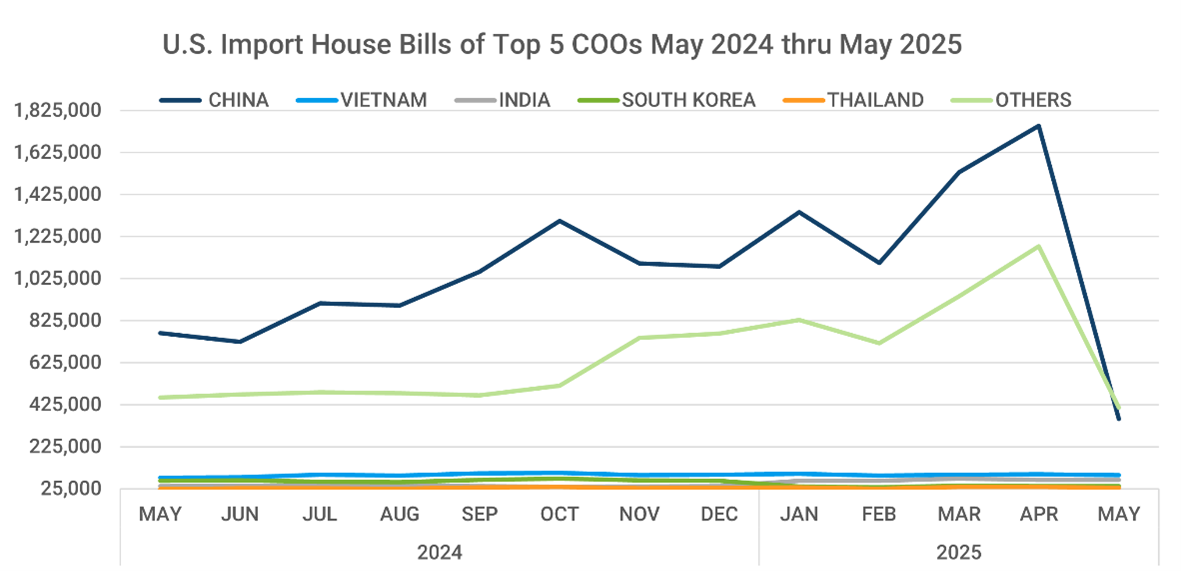
Along with a surge in total import volume ahead of a wave of U.S. tariff increases, the Descartes Datamyne trade data also shows an even sharper rise in the number of shipment records. See, for example, the next chart tracking the growth in the number of house bills of lading. The data indicates China was a primary source of the increase in shipments.
Figure 8 U.S. Import Shipments from the Top Countries of Origin over 13 Months Ending May 2025
Source: Descartes Datamyne
The next chart traces the monthly rise or fall in BOL records of U.S. import shipments from the top Countries of Origin (COOs) as compared with each country’s April 2024 tally (this benchmark is set in the vertical axis at 100%). China’s leading role in boosting the sheer number of shipments through April 2025 is evident.
Figure 9 Percentage Change in Number of Shipments from Top Countries of Origin May 2024 through May 2025
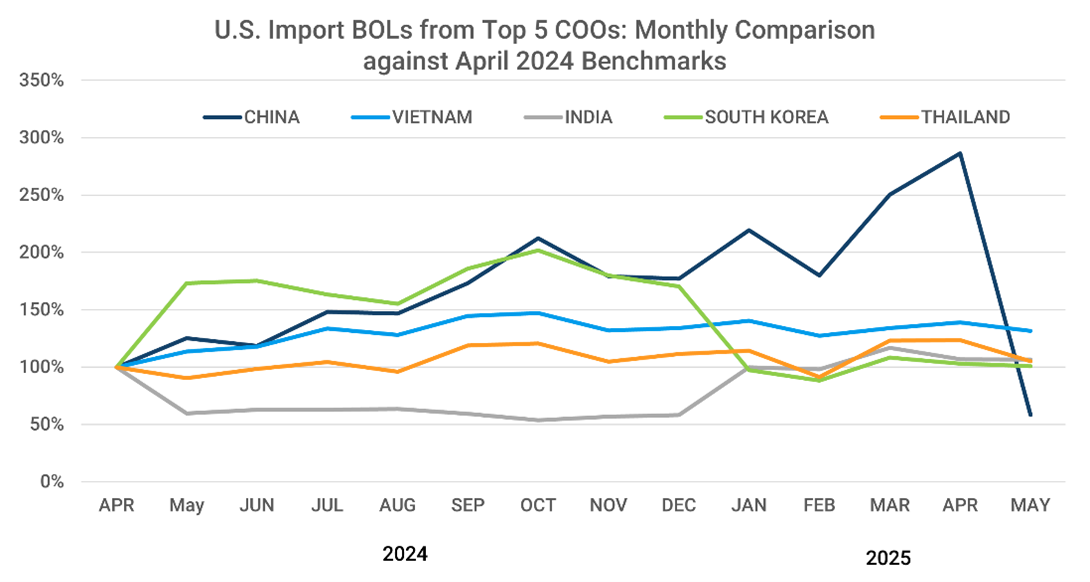
Source: Descartes Datamyne
The October, January, and May spikes in many more, smaller shipments from China were mirrored in increases in less-than-full container loads (LCL), while full container loads (FCL) carrying the goods of a single shipper dwindled—further indicating a strategic shift in China import logistics.
Figure 10 Full vs Partial Container Loads of Shipments from China 12 Months Ending May 2025
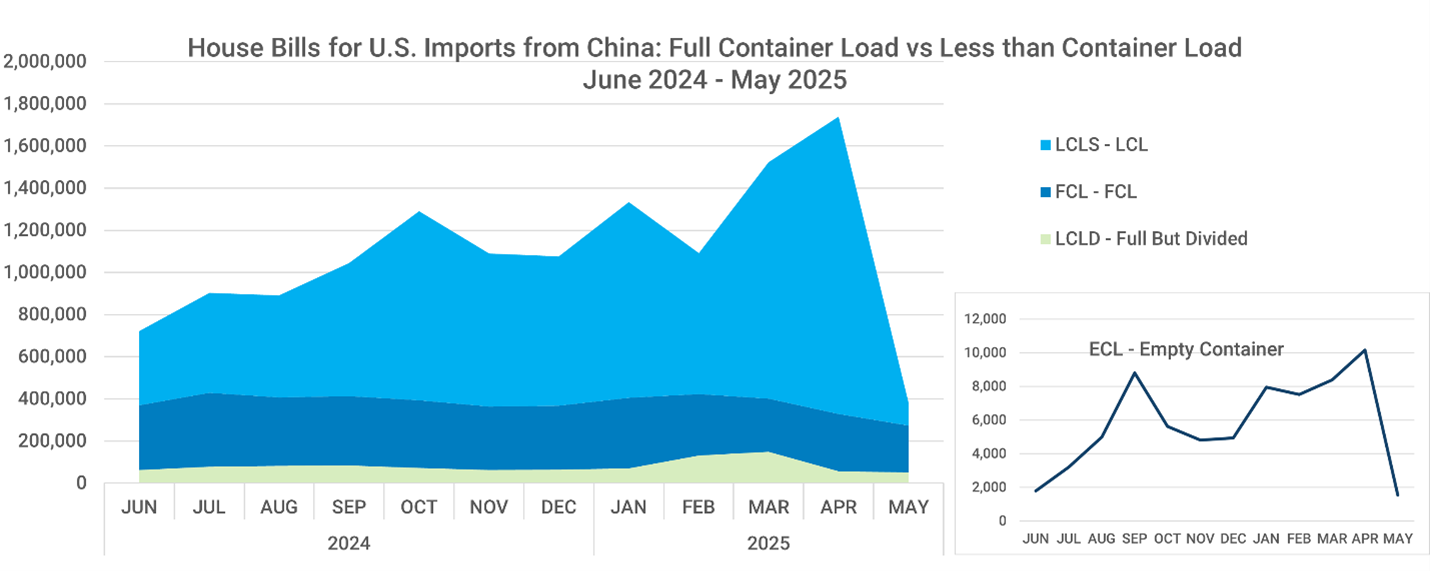
Source: Descartes Datamyne
To learn more about China’s run-up in U.S.-bound shipments, we drew on Descartes Datamyne U.S. Census data, which provides the North American Industry Classification System, or NAICS, codes assigned to import records.
Figure 11 Monthly Breakout by NAICS Code of Shipments from China
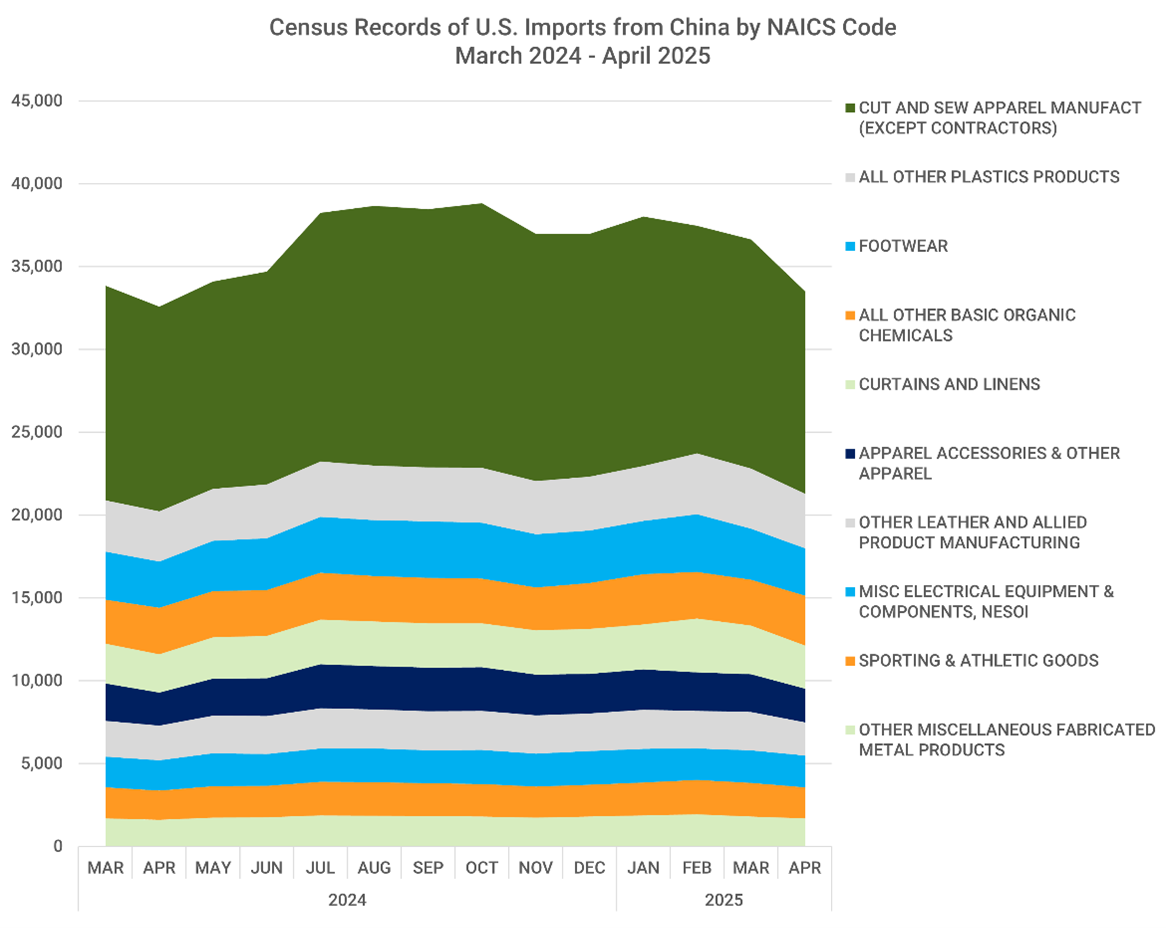
Source: Descartes Datamyne
As the data chart indicates, apparel, footwear, and accessories together accounted for the largest share of individual shipments from China through the end of April 2025—underscoring the importance of China imports in key retail categories.
Note that the Census records cover imports that arrive by ship, air, or overland. These records do not cover the increase in packages shipped direct from China to consumers by ecommerce retailers under the de minimis exemption from duties for shipments under $800. The exemption ended May 2nd under a different tariff policy change that also accelerated, then throttled inexpensive “fast fashion” China imports this Spring.
Long Beach Rides the Surge
As Freight Waves reports, the trade war effect boosted inbound TEUs at the Port of Long Beach to record heights this April. Long Beach was the leading beneficiary of the push to get many more, smaller shipments delivered to the U.S. ahead of tariff increases, as the next chart, drawing on Descartes Datamyne U.S. maritime import data makes clear:
Figure 12 Monthly Number of Shipments Arriving at Top U.S. Ports June 2024 through May 2025
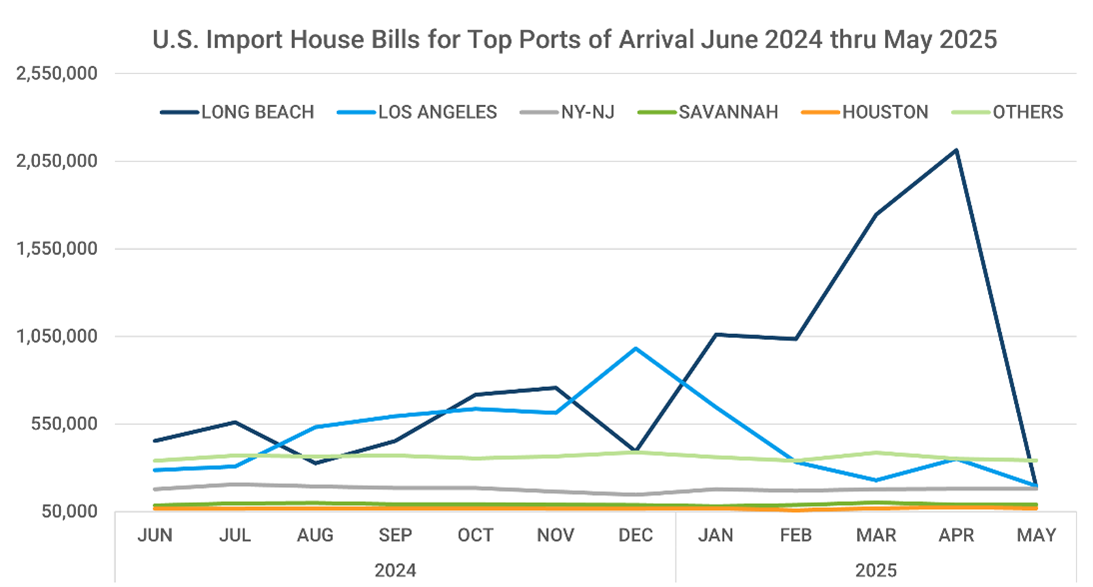
Source: Descartes Datamyne
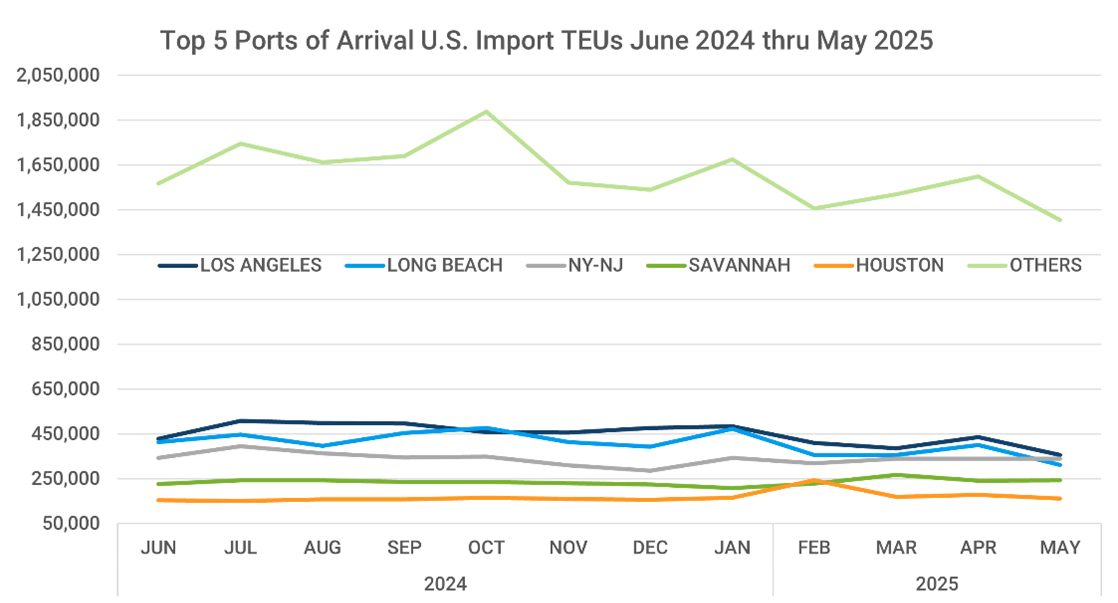
The effect of the surge in small shipments was more muted on the top ports’ TEU volumes, as the next chart illustrates. But the added volume did help lift Long Beach to top-volume ranking in October 2024, and kept it at No. 2, just behind Los Angeles, until May 2025—largely due to strong activity in China imports.
Figure 13 Monthly TEU Volumes Arriving at Top U.S. Ports June 2024 through May 2025
Source: Descartes Datamyne
How Descartes Can Help
In a time of volatile trade policies, disrupted supply chains, and shifting global sourcing strategies, visibility into import activity is more critical than ever. Descartes Datamyne delivers the earliest and most granular trade data available—tracking maritime shipments with bill-of-lading details just two days after arrival.
Whether you're monitoring sourcing shifts, identifying impacted supply chains, or assessing competitor movements, our data reveals:
- Shipment-level detail by product, shipper, and consignee
- Volume and frequency trends by country, port, and carrier
- Emerging patterns driven by tariffs, quotas, and policy changes
Want to stay ahead of the next disruption? Schedule a free demo to see how Descartes Datamyne can power smarter, faster trade decisions.