
2026 Transportation Management Benchmark Survey
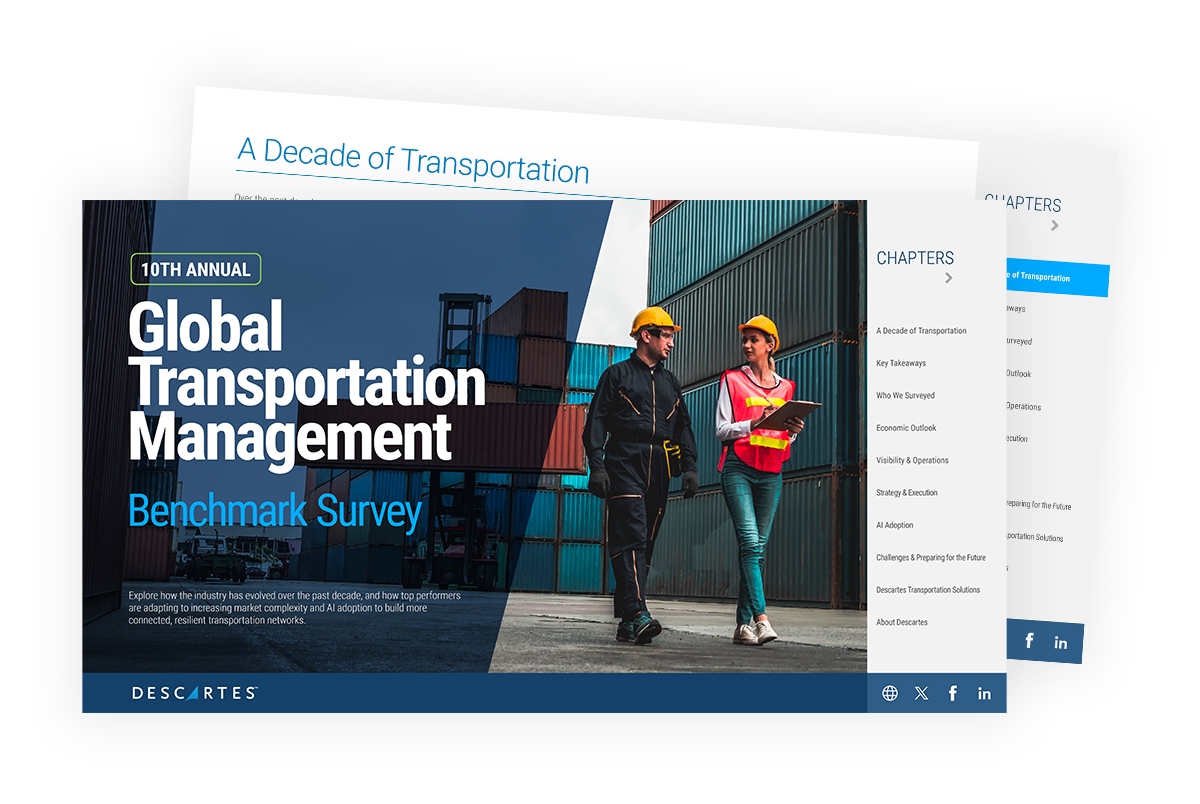
The 10th Annual Descartes Transportation Management Benchmark Survey explores how the industry has evolved over the past decade, and how top performers are adapting to build more connected, resilient transportation networks.
Check out the results!
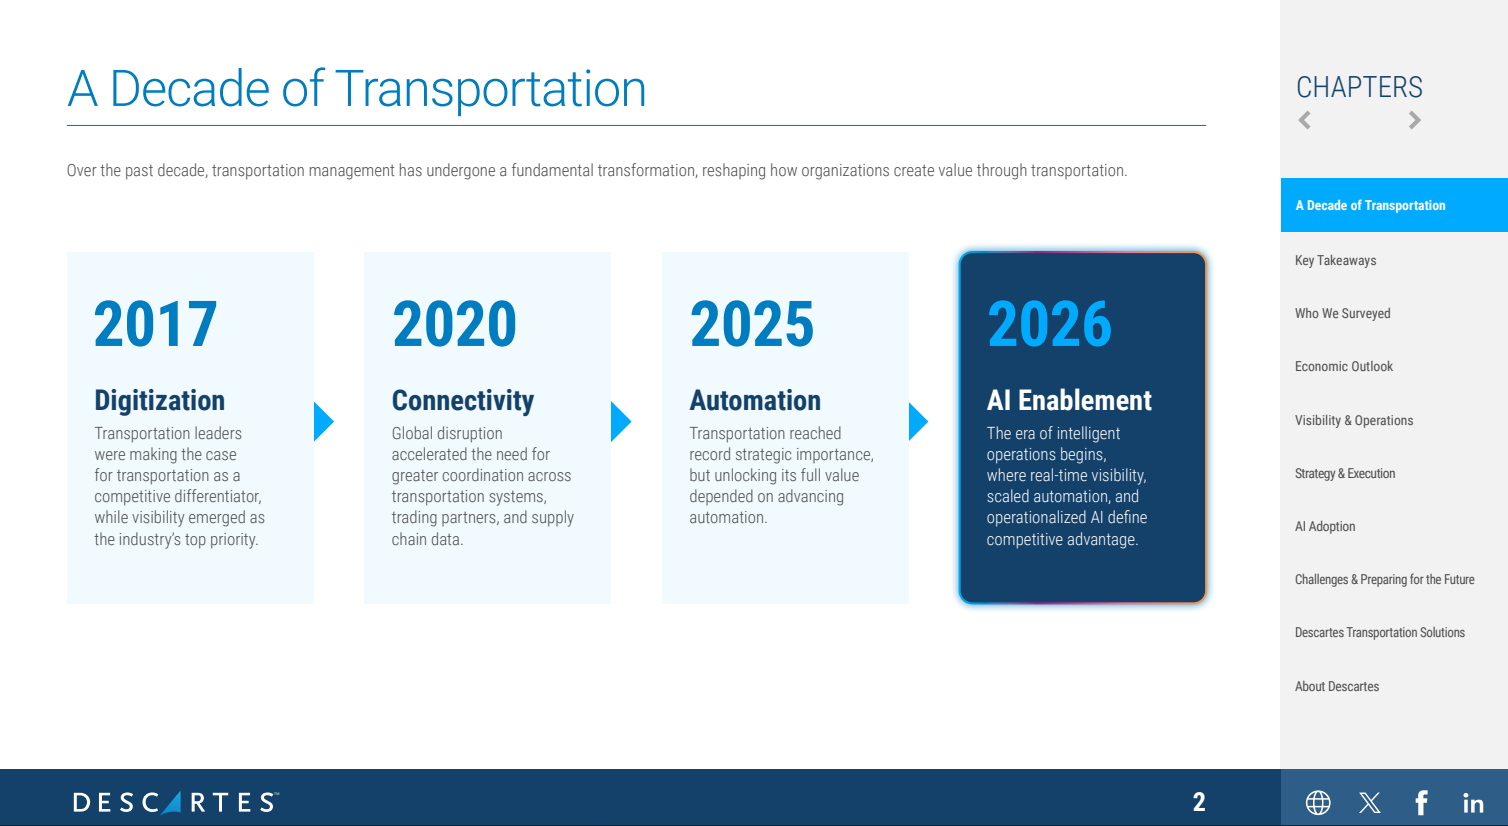
A Decade of Transformation
Over the past 10 years, three defining shifts have shaped today's industry landscape.

Transportation management became strategic

Technology investment became mainstream

Visibility became the foundation for AI
What's in the eBook?
The Benchmark Survey eBook unpacks perspectives from senior decision-makers on the trends shaping transportation management today, from market outlook and operational performance to AI adoption and long-term strategy. Inside, you'll find:
- Economic trends influencing transportation investment and growth
- Operational gaps across visibility, automation, and connectivity
- Strategic priorities driving transportation performance
- AI adoption, operational maturity, and barriers to scale
- The priorities defining transportation over the next five years
Key Takeaways
The survey reveals an industry balancing growth, operational transformation, and AI adoption. Here are key findings, by the numbers.
| Industry-Wide | For Shippers | For LSP |
|---|---|---|
| Data quality is the biggest barrier to scaling AI. | 82% expect to increase transportation management IT investment. | 67% are using AI for realtime visibility and tracking. |
| Fewer than 1 in 5 organizations are using AI at scale | Truckload leads all transportation modes in demand for real-time visibility. | Real-time visibility ranks as the #1 future TMS value driver. |
| Business growth remains the leading driver for TMS adoption | 79% expect 5%-15%+ annual growth over the next two years. | Automation is reported as the largest operational opportunity. |
Browse the Benchmark
Discover a decade of benchmark research, perspectives from 300 industry leaders, and actionable insights across five research areas.

Looking for the right transportation technology?
Connect with our team to learn how we can help make transportation management easier.
Explore the Results
Dive into the full collection of survey data to learn about the priorities, challenges, and investment trends shaping operations today, and see how your transportation strategy compares.
Economic Outlook
Predicted annual growth over the next 2 years
Survey responses point to continued market resilience despite ongoing trade uncertainty and broader market volatility. Nearly three-quarters of LSPs expect annual growth of 5–15% over the next two years, up 26 points year over year. Shippers also remain optimistic, with 79% forecasting at least 5% annual growth.
| Shrink | Limited/no growth | Less than 5% | 5–15% | Greater than 15% | |
|---|---|---|---|---|---|
| Shippers | 1% | 4% | 16% | 64% | 15% |
| LSPs | 1% | 3% | 13% | 74% | 10% |
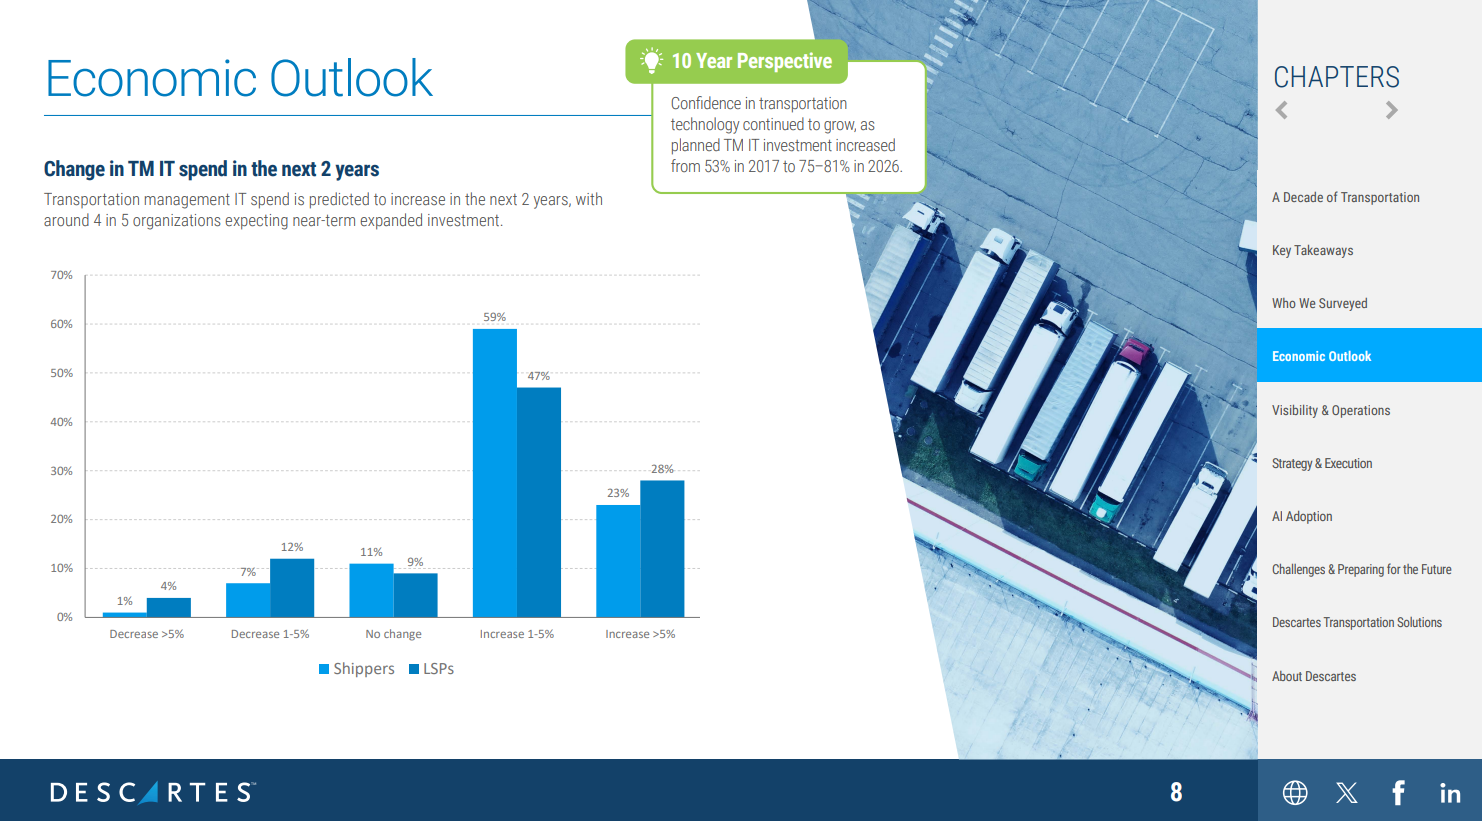
Change in TM IT spend in the next 2 years
Transportation management technology investment remains a strategic priority. More than three-quarters of organizations expect to increase TM IT spending over the next two years, with roughly one-quarter planning increases greater than 5%.
| Decrease >5% | Decrease 1–5% | No change | Increase 1–5% | Increase >5% | |
|---|---|---|---|---|---|
| Shippers | 1% | 7% | 11% | 59% | 23% |
| LSPs | 4% | 12% | 9% | 47% | 28% |
Visibility & Operations
Top 10 gaps in current transportation system/service
Real-time visibility remains the most significant operational gap for shippers, with 27% identifying it as their top challenge, reflecting the continued difficulty of maintaining end-to-end visibility across increasingly complex transportation networks. For LSPs, automation (26%) and carrier connectivity (25%) emerge as the top operational priorities, highlighting the continued focus on streamlining transportation execution.
| Real-time visibility | Automation | Carrier connectivity/integrations | Optimized planning across modes | Analytics/BI dashboards | Carrier vetting/fraud prevention | Order management into shipments | Freight invoice audit/pre-billing | Carrier Monitoring | Carrier/capacity sourcing | |
|---|---|---|---|---|---|---|---|---|---|---|
| Shippers | 27% | 25% | 21% | 19% | 17% | 15% | 15% | 15% | 13% | 13% |
| LSPs | 13% | 26% | 25% | 18% | 11% | 19% | 18% | 14% | 17% | 14% |
How organizations gain shipment visibility
Digital visibility is well established across transportation operations, with GPS/ELD tracking used by 52% of shippers and 59% of LSPs, and carrier portals used by 53% and 54%, respectively. Yet 35% of shippers and 41% of LSPs still rely on spreadsheets or post-delivery emails, highlighting continued opportunities to modernize shipment visibility.
| Real-time GPS/ELD tracking | Carrier/broker status portals | Spreadsheets/email after delivery | EDI updates from carriers | Call carriers/brokers | Struggle to get visibility | |
|---|---|---|---|---|---|---|
| Shippers | 52% | 53% | 35% | 37% | 26% | 3% |
| LSPs | 59% | 54% | 41% | 35% | 37% | 1% |
Modes needing most improvement in real-time visibility
Full truckload has become the most urgent priority for real-time visibility, rising 14 points year over year among shippers and 19 points among LSPs. LTL ranks second for both groups, reinforcing that the greatest visibility opportunities remain concentrated in over-the-road transportation, where execution is often the most dynamic and complex.
| Full Truckload | Less than Truckload | Parcel | Private/Dedicated Fleet | Ocean | Air | Inter/multimodal | Rail | None | |
|---|---|---|---|---|---|---|---|---|---|
| Shippers | 57% | 37% | 27% | 18% | 13% | 11% | 9% | 7% | 3% |
| LSPs | 43% | 41% | 21% | 13% | 13% | 19% | 12% | 19% | 2% |
Strategy & Execution
Maturity of transportation technology adoption
Only 16% of shippers and 13% of LSPs describe their transportation operations as fully automated with AI. Most remain in the middle of the maturity curve. Coupled with a slight decline in maturity level year over year, the results suggest many organizations are still working to extend automation beyond individual processes into network-wide operations.
| Fully automated + AI | Mostly automated | Partially automated | Minimal automation | No automation | |
|---|---|---|---|---|---|
| Shippers | 16% | 37% | 33% | 12% | 2% |
| LSPs | 13% | 27% | 47% | 13% | 0% |
Business drivers for transportation management system (TMS)
Business growth remains the leading driver of TMS adoption for both shippers (53%) and LSPs (48%). Beyond growth, shippers are more likely to invest in a TMS to optimize existing operations, while LSPs are more often driven by initiatives that support business expansion.
| Business growth | Cost reduction pressure | Improved customer service | Better leverage of staff | New sales channels | Geographic expansion | Expanded product offerings | Capacity shortage | International expansion | Merger/acquisition | |
|---|---|---|---|---|---|---|---|---|---|---|
| Shippers | 53% | 45% | 44% | 35% | 28% | 23% | 23% | 20% | 15% | 13% |
| LSPs | 48% | 37% | 39% | 32% | 31% | 27% | 24% | 23% | 23% | 17% |
TMS capabilities delivering the greatest value in the next 2 years
Organizations continue to prioritize TMS capabilities that strengthen planning, visibility, and execution. Shippers place the greatest value on optimized planning across modes (34%), while LSPs prioritize real-time visibility (29%) and order-to-shipment management (28%).
| Optimized planning across modes | Contract/rate management | Real-time visibility | Order management into shipments | Procurement/bid management | Carrier connectivity/integrations | Automation reducing manual intervention | Carrier vetting/fraud prevention | Carrier Monitoring | Fleet routing & execution | |
|---|---|---|---|---|---|---|---|---|---|---|
| Shippers | 34% | 23% | 21% | 19% | 18% | 17% | 17% | 14% | 13% | 9% |
| LSPs | 26% | 13% | 29% | 28% | 10% | 22% | 21% | 14% | 11% | 15% |
Strategic importance of transportation
Transportation’s role continues to expand beyond execution, with organizations increasingly recognizing its impact on customer experience and business performance. Organizations in the US are more likely to view transportation as a competitive weapon (US 32% vs. Canada 15%), while those in Canada more commonly view it as a customer service differentiator (Canada 73% vs. US 15%).
| Competitive weapon | Customer service differentiator | Basic service | Necessary evil | |
|---|---|---|---|---|
| Shippers | 27% | 54% | 15% | 3% |
| LSPs | 28% | 59% | 11% | 2% |
AI Adoption
Level of AI Adoption
AI engagement is nearly universal, but scaled adoption remains limited. Only 19% of shippers and 15% of LSPs report using AI at scale, while most are still exploring, piloting, or partially deploying it.
| Using AI at scale | Partially deployed | Piloting | Exploring | Not exploring | |
|---|---|---|---|---|---|
| Shippers | 19% | 25% | 24% | 29% | 3% |
| LSPs | 15% | 23% | 22% | 38% | 1% |
Leading AI Use Cases
Early AI adoption is centered on improving operational efficiency, with transportation teams prioritizing transportation optimization (30%), automation (28%), and data-driven decision support (28%).
| Routing/transport/shipment optimization | Efficiency & automation | Data analysis/forecasting/decision support | Customer service & communication | Warehouse/inventory/operations management | |
|---|---|---|---|---|---|
| Respondents | 30% | 28% | 28% | 20% | 12% |
Biggest barriers to scaling AI
Data quality is the leading barrier to scaling AI, cited by 33% of shippers and 45% of LSPs. Integration complexity and unclear ROI follow closely. Skills, change management, and vendor maturity rank notably lower, suggesting organizational readiness is no longer the primary constraint. Looking ahead, transportation teams are functionally prepared to expand AI, but realizing its full value at scale will depend on the digital infrastructure behind it.
| Data quality | Integration complexity | Unclear ROI | Lack of skills | Change management | Vendor maturity | No barriers to scaling AI | |
|---|---|---|---|---|---|---|---|
| Shippers | 33% | 39% | 31% | 22% | 16% | 13% | 16% |
| LSPs | 45% | 38% | 35% | 21% | 15% | 20% | 8% |
Use of AI in transportation
Real-time visibility/tracking, data entry, and customer service are among the most widely deployed AI use cases in transportation; however, shippers and LSPs are prioritizing AI differently. Shippers are equally focused on automating data entry (58%) and strengthening customer service (58%), while LSPs are using AI for real-time visibility/tracking (67%) and route optimization (63%).
| Data entry | Customer service | Document capture | Fraud detection | Real-time visibility/tracking | Route/load optimization | |
|---|---|---|---|---|---|---|
| Shippers | 58% | 58% | 55% | 53% | 51% | 51% |
| LSPs | 62% | 53% | 54% | 56% | 67% | 63% |
Benefits realized from AI
Survey responses indicate that the greatest realized value from AI comes from improving day-to-day transportation operations. Shippers report the strongest gains in reduced administrative and labor costs (55%), while LSPs see the greatest benefit in improved service (53%) and freight cost reduction (46%).
| Admin/labour costs | Improved service | Productivity gains/labour efficiencies | Risk reduction | Freight cost reduction | Revenue growth | |
|---|---|---|---|---|---|---|
| Shippers | 55% | 53% | 49% | 41% | 40% | 38% |
| LSPs | 48% | 53% | 49% | 43% | 46% | 36% |
Challenges & Preparing for the Future
Biggest transportation challenge
Cost pressures continue to dominate current transportation priorities. Freight cost management ranks as the biggest challenge for both shippers (35%) and LSPs (25%), followed by operating cost management (19% and 21%, respectively), far outpacing every other transportation challenge.
| Freight cost management | Operating cost management | Finding qualified labor | Ineffective/outdated systems/tools | Capacity availability | Carrier reliability | Regulations | Manual processes | Lack of real-time visibility/alerts | Fraud/theft | No major challenges | |
|---|---|---|---|---|---|---|---|---|---|---|---|
| Shippers | 35% | 19% | 10% | 7% | 5% | 5% | 5% | 5% | 4% | 3% | 2% |
| LSPs | 25% | 21% | 5% | 5% | 9% | 9% | 9% | 5% | 3% | 6% | 1% |
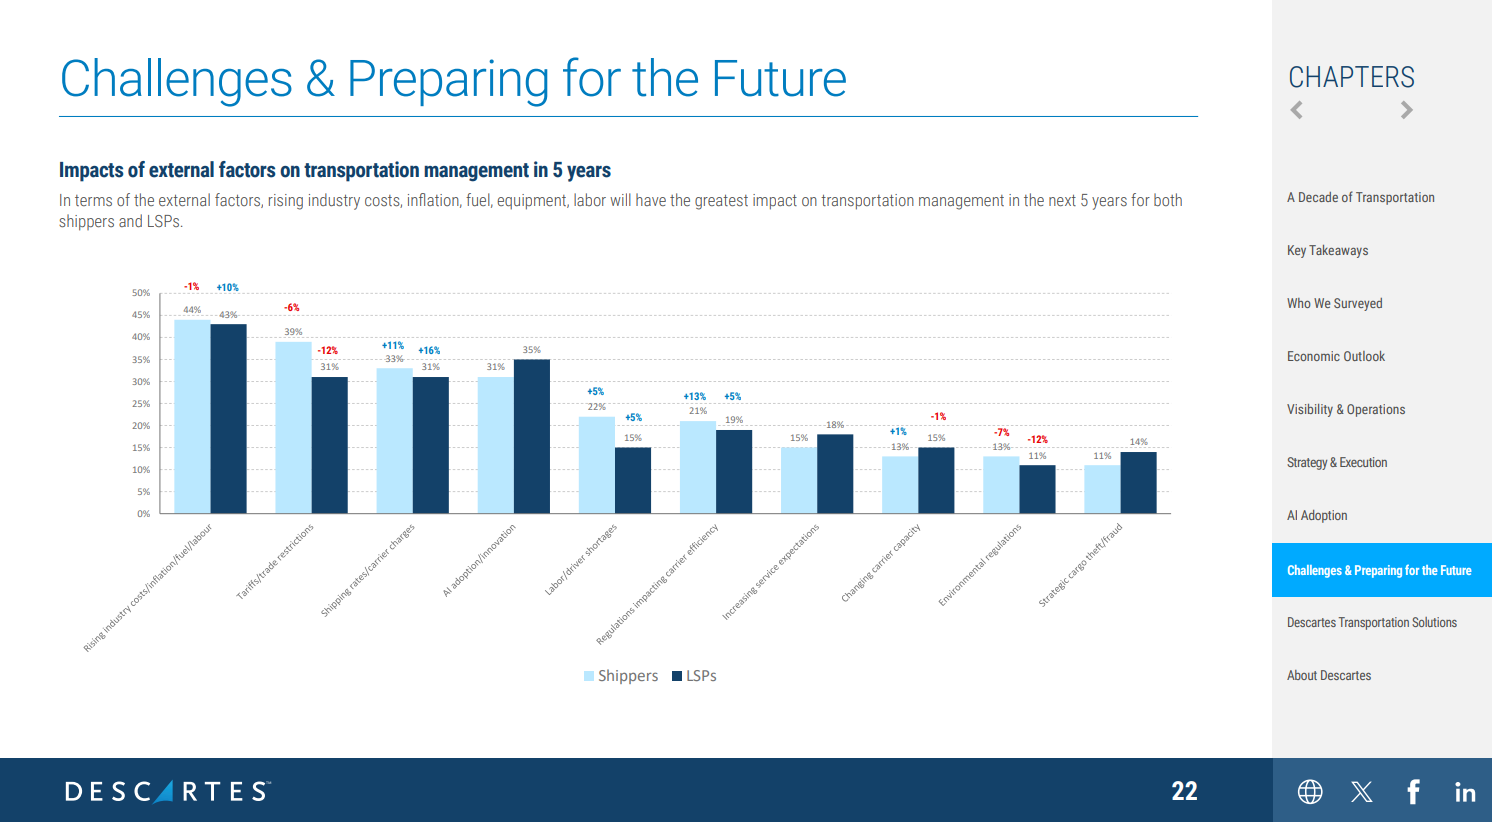
Impacts of external factors on transportation management in 5 years
Cost-related pressures dominate the five-year outlook as well, with rising industry costs ranked highest by both shippers (44%) and LSPs (43%). Introduced as a survey response option for the first time this year, AI adoption and innovation already ranks as the third-highest external factor overall and second among LSPs (35%), underscoring how quickly it has become one of the industry’s defining long-term priorities.
| Rising industry costs/inflation/fuel/labor | Tariffs/trade restrictions | AI adoption/innovation | Shipping rates/carrier charges | Labor/driver shortages | Regulations impacting carrier efficiency | Increasing service expectations | Changing carrier capacity | Environmental regulations | Strategic cargo theft/fraud | |
|---|---|---|---|---|---|---|---|---|---|---|
| Shippers | 44% | 39% | 31% | 33% | 22% | 21% | 15% | 13% | 13% | 11% |
| LSPs | 43% | 31% | 35% | 31% | 15% | 19% | 18% | 15% | 11% | 14% |
Transportation priorities in the next two years
Transportation priorities reflect a dual mandate: scale AI while controlling costs. AI adoption is the top shared priority, cited by 29% of both shippers and LSPs, but cost pressures differ by segment. Shippers emphasize freight cost reduction (36%), while LSPs balance operating cost reduction (27%) with business growth (22%).
| Increase AI adoption | Reduce freight costs | Reduce operating cost | Increase automation | Support business growth | Expanding carrier network | Improve resilience/reduce risk | Improve sustainability | Improve service levels | Customer-facing tools | Analytics/insights | |
|---|---|---|---|---|---|---|---|---|---|---|---|
| Shippers | 29% | 36% | 20% | 19% | 17% | 16% | 15% | 15% | 11% | 9% | 9% |
| LSPs | 29% | 21% | 27% | 17% | 22% | 14% | 15% | 13% | 13% | 15% | 13% |
Research Methodology
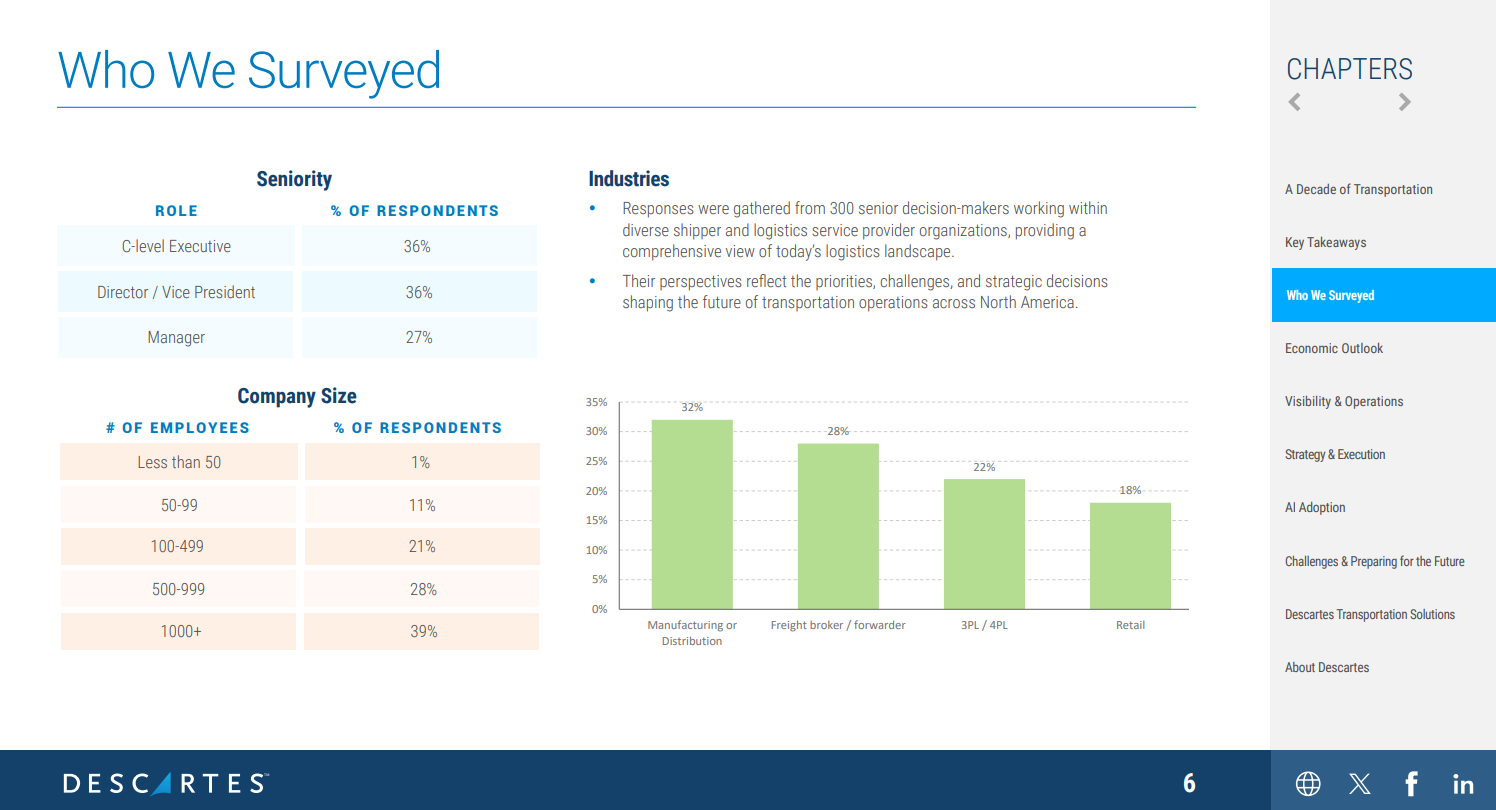
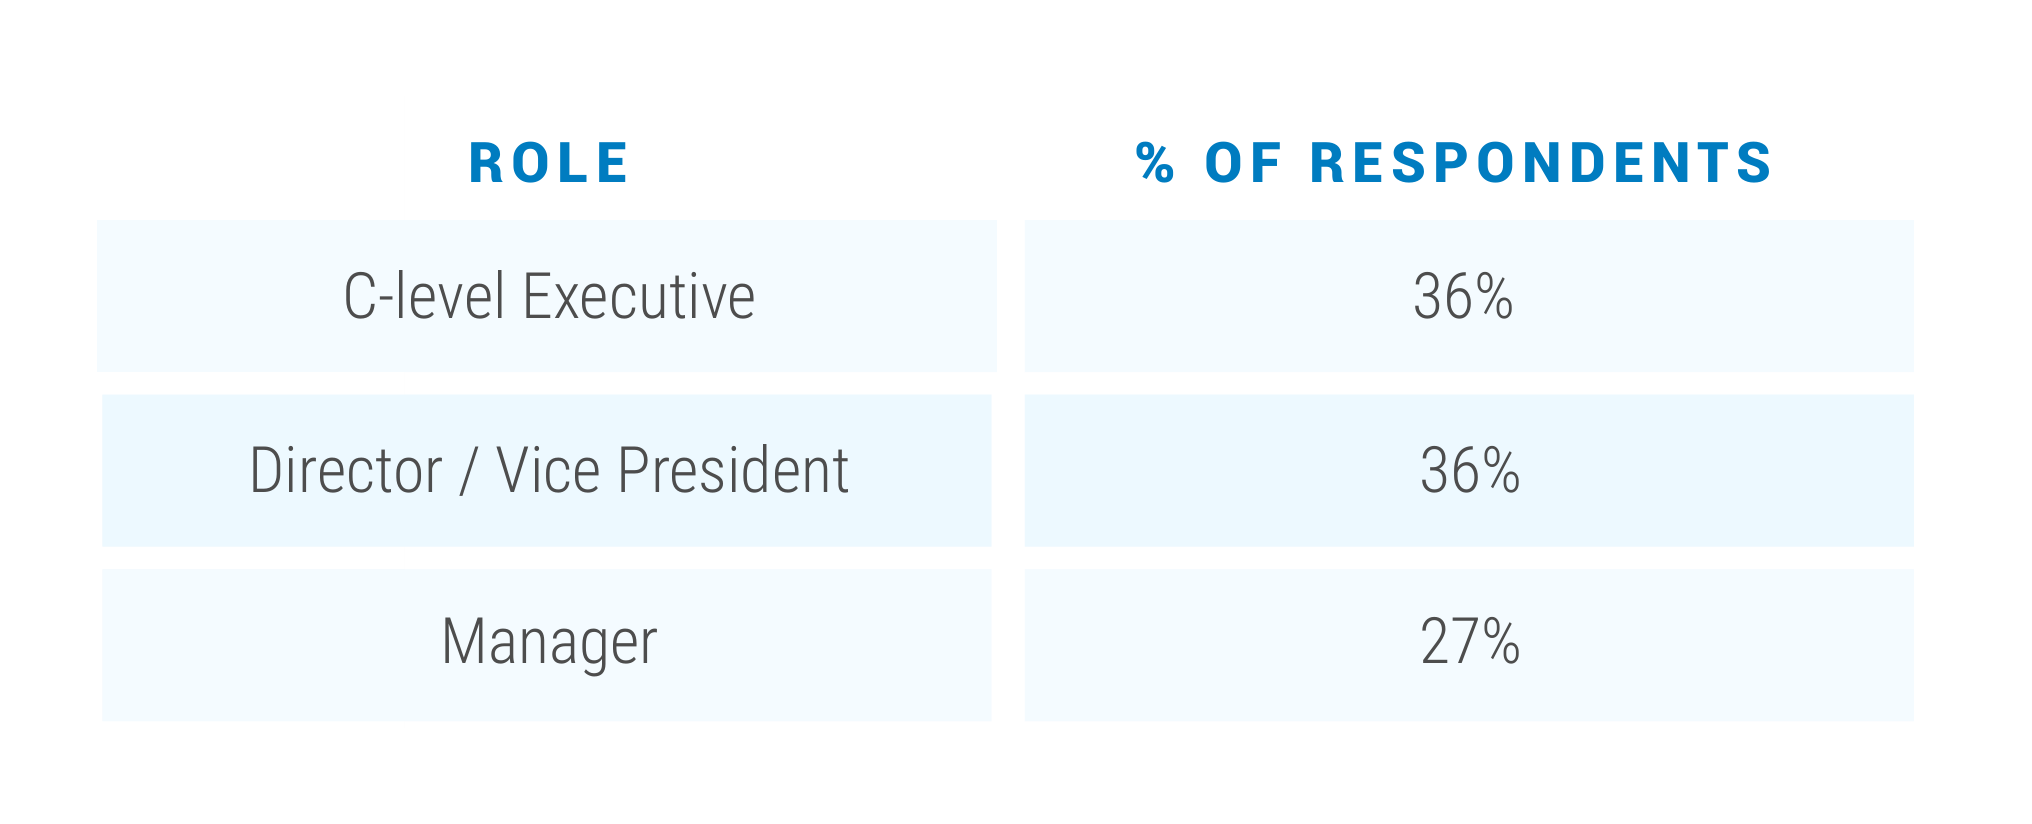
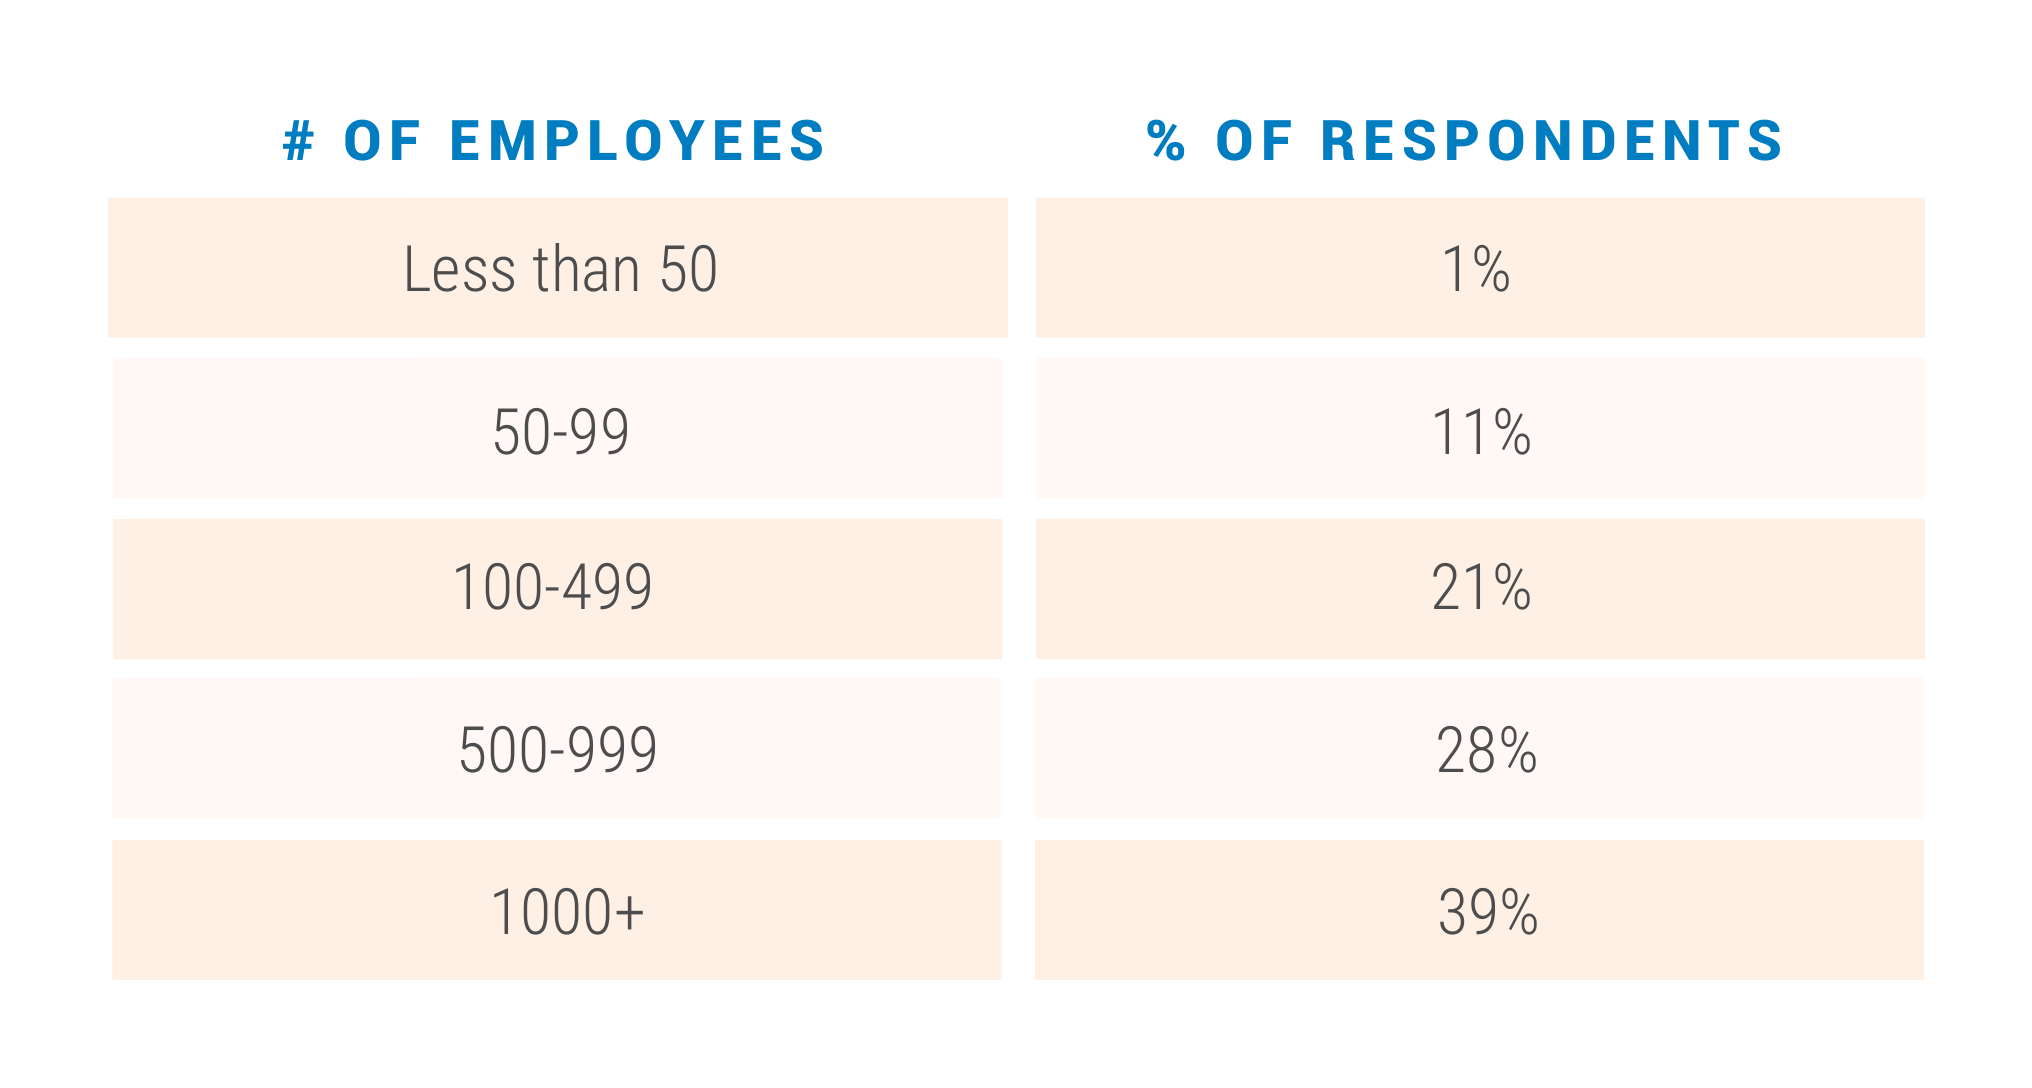
For the collection of the data within this benchmark survey, responses were gathered from 300 senior decision-makers working within diverse shipper and logistics service provider organizations, providing a comprehensive view of today’s logistics landscape. These were individuals across the USA and Canada with Manager, Director, Vice President, and / or C-suite job titles.
Seniority
Company Size
Ready to make transportation your competitive advantage?
Connect with our product experts to learn how Descartes can help your team manage, monitor, and secure your freight.