The Global Shipping Report
January U.S. Container Imports Post Seasonal Rebound as Policy Uncertainty Persists
Stay informed with the latest insights from the Descartes Global Shipping Report
Data for the Global Shipping Report provided by Descartes Datamyne
In January 2026, U.S. containerized imports totaled 2,318,722 twenty-foot-equivalent units (TEUs) as volumes rebounded from December’s seasonal slowdown. While imports declined on a year-over-year basis, January volumes exceeded the historical average for the month, likely pointing to a more normalized trade environment shaped by steady demand rather than frontloading activity.
Port-level performance was broadly positive in January, with gains concentrated at several major gateways, including Houston, Oakland, New York/Newark, and a notable rebound across Gulf Coast ports. Port transit delays showed only modest, uneven changes in January, with no signs of widespread congestion. China-origin imports increased month-over-month and regained share following late-2025 softness, though overall volumes remain well below prior peaks. At the same time, sustained growth from Southeast Asian origins continues to partially offset decreased volumes from China.
In January 2026, shipping conditions remain influenced more by policy and geopolitical developments than by operational constraints. Renewed transatlantic trade uncertainty emerged as the European Union (EU) moved to suspend approval of a proposed U.S.–EU trade agreement, while U.S. actions targeting countries linked to Cuban oil trade expanded the scope of potential tariff exposure. At the same time, elevated tensions between the U.S. and Iran have kept maritime risk in focus around key Middle East shipping lanes. Together, these developments underpin much of the volatility and uncertainty facing global trade and maritime planning as 2026 begins.
In this Article...
- U.S. container imports reached 2,318,722 TEUs in January 2026.
- January 2026 imports increased by 4.1% over December and were 6.8% lower than January 2025.
- January 2026 imports from China were 771,093 TEUs, up 9.3% from December and 24.6% below the record high of 1,022,913 TEUs set in July 2024.
- January 2026 U.S. imports from the top 10 countries of origin (CoO) increased by 7% over December, led by gains from China and India.
- In January 2026, market share at West Coast ports contracted, while the share at East and Gulf Coast ports increased.
- January 2026 port transit delays showed modest changes with improvements at several West Coast ports and localized increases at select Gulf Coast and Southeast gateways, but no signs of widespread congestion.
- EU suspension of a U.S.–EU trade deal adds uncertainty to transatlantic trade and global shipping outlooks.
- Lower U.S. tariffs on Indian goods could support higher bilateral trade and shifting sourcing patterns.
- New U.S. tariff authority targeting Cuba-linked oil trade expands policy risk for affected trade corridors.
- Elevated U.S.–Iran tensions increase risk around the Strait of Hormuz, with potential impacts on routing and insurance costs.
- A potential Red Sea reopening could release capacity and pressure freight rates, but timing and security remain uncertain.
- Key points to monitor and manage supply chain risks.
- Recommendations to help mitigate global shipping challenges.
U.S. container imports decline year-over-year but remain seasonally resilient.
U.S. container import volumes reached 2,318,722 TEUs in January 2026, representing a 6.8% decline compared with January 2025 (see Figure 1). Despite the year-over-year decrease, January 2026 volumes came in slightly above the six-year average for the month and were up 11.8% over January 2019. In contrast to the suspected influence of frontloading on January 2025 volumes, January 2026 volumes appear to reflect a more normalized import environment, with importers conditioned to ongoing trade policy uncertainty rather than reacting to it.
Figure 1: U.S. Container Import Volume Year-over-Year Comparison
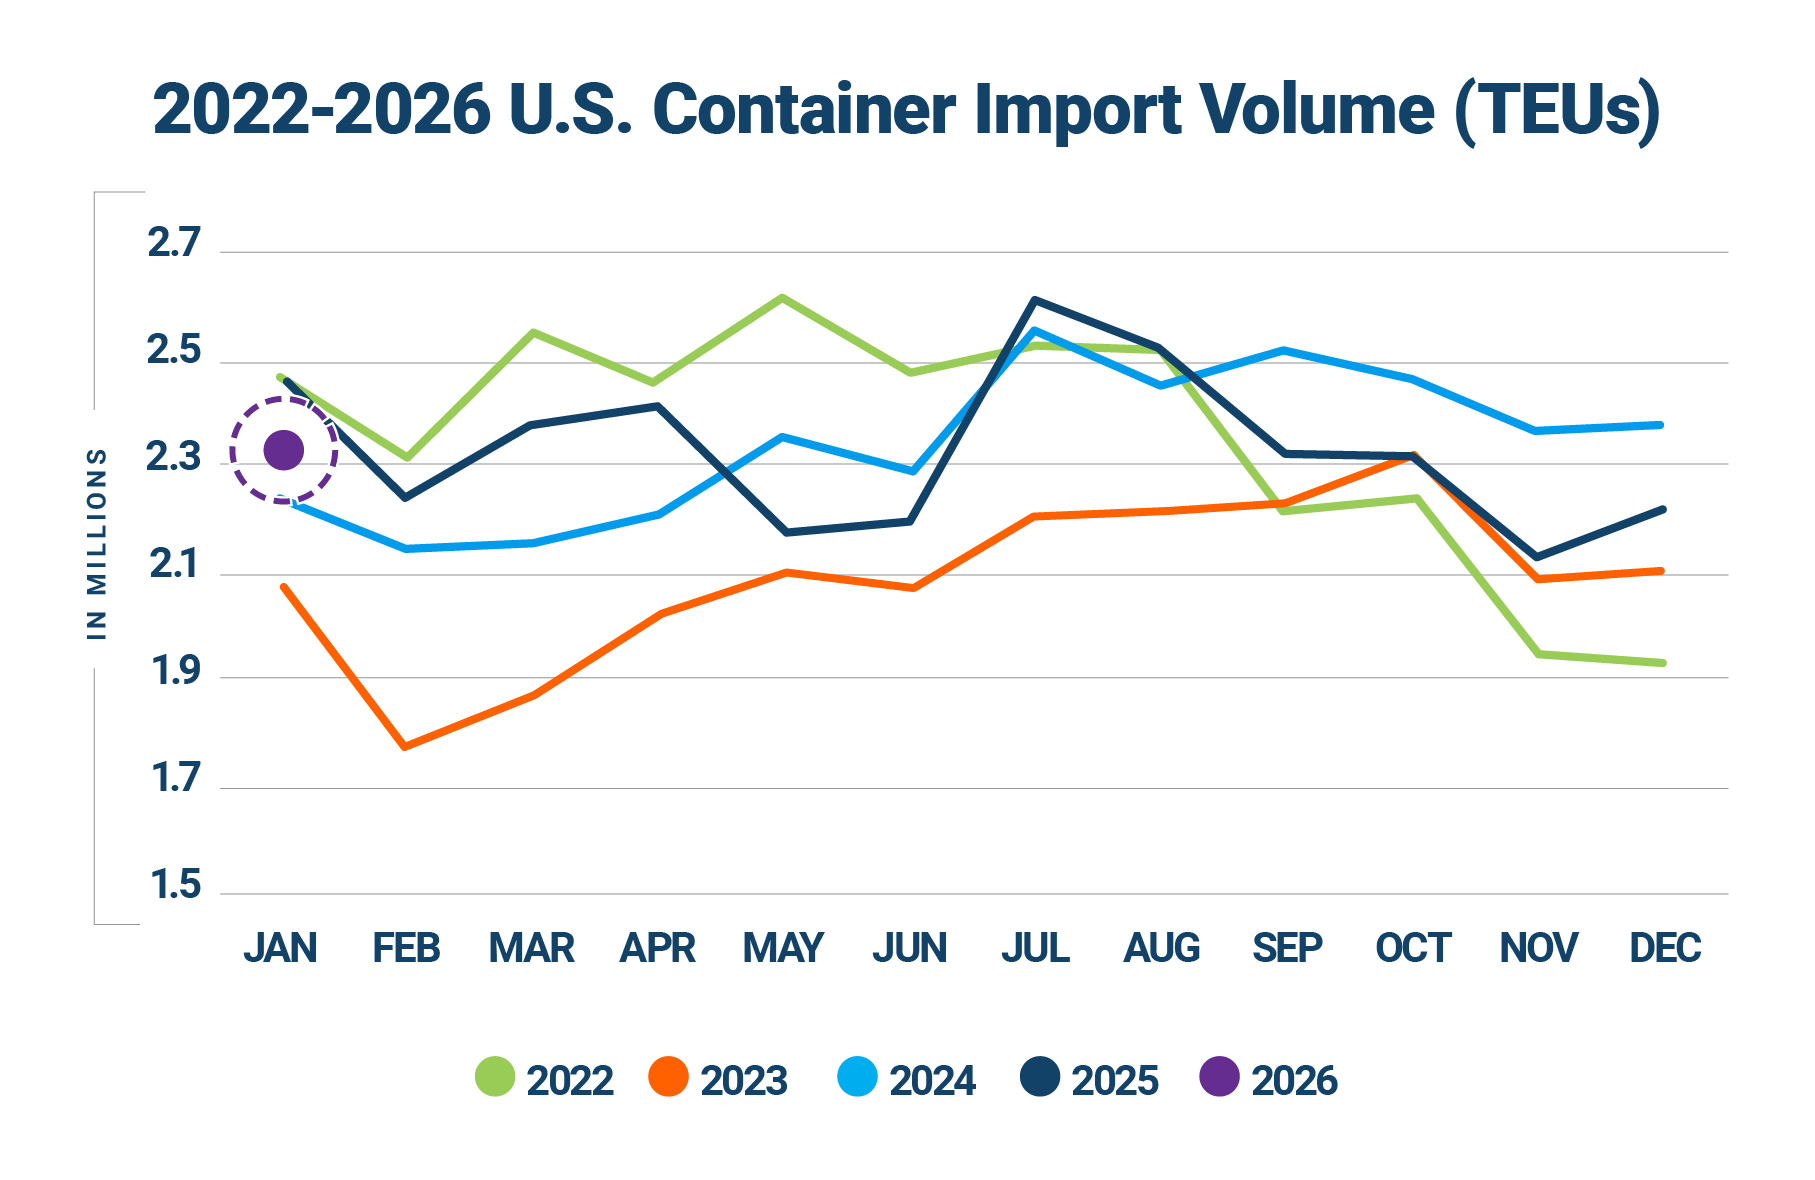
Source: Descartes Datamyne™
January 2026 import volumes rose 4.1% from December, an increase of 91,407 TEUs (see Figure 2) continuing to follow a seasonal, post-pandemic trend of month-over-month increases. Against the seasonal backdrop, January 2026 stands as the fourth-strongest January on record, only slightly behind January 2021, highlighting the continued resilience of U.S. import demand despite ongoing policy and economic uncertainty.
Figure 2: December to January U.S. Container Import Volume Comparison

Source: Descartes Datamyne™
Top 10 U.S. port volumes rise in January, led by Houston and Oakland.
Container volumes across the top 10 U.S. ports increased by 92,150 TEUs in January 2026, a 4.9% month-over-month gain (see Figure 3). Performance across individual ports was mixed, with gains concentrated at several key gateways. Houston recorded the largest increase, rising 28.5% (39,338 TEUs), while Oakland posted a 15.2% gain (11,264 TEUs) and New York/Newark increased 8.3% (24,969 TEUs). Additional growth was observed at Tacoma (10.8%), Savannah (2.5%), Norfolk (3.7%), and Long Beach (2.0%). Philadelphia volumes were essentially flat, increasing just 0.1%. Not all ports participated in the January expansion. Los Angeles declined 1.0% (4,162 TEUs), while Charleston posted a 3.2% decrease (3,070 TEUs). Overall, the January increase suggests import demand at the top 10 ports remained resilient at the start of the year.
Figure 3: December 2025 to January 2026 Comparison of Import Volumes at Top 10 U.S. Ports

Source: Descartes Datamyne™
China imports rebound month-over-month while remaining well below peak levels.
U.S. containerized imports from China totaled 771,093 TEUs in January 2026, up 9.3% month-over-month (see Figure 4), down 22.7% year-over-year, and 24.6% below the July 2024 peak. China’s share of total U.S. container imports increased to 33.3%, reversing the decline observed over the previous two months (Dec. 2025: 31.7%, Nov. 2025: 32.7%).
China’s import mix in January 2026 remained heavily concentrated in consumer goods and industrial inputs. Furniture and bedding (HS-94) was the largest category at 126,149 TEUs, accounting for 16.4% of China-origin imports, followed closely by plastics (HS-39) at 15.4%. Machinery (HS-84) and electrical machinery (HS-85) together represented 18.3% of total volume, reinforcing the continued importance of industrial inputs within China-origin trade. Discretionary categories played a smaller role. Apparel, footwear and other textiles (HS-61, HS-62, HS-63, HS-64) combined made up 6.5% of total volume, while toys and sporting goods (HS-95) accounted for 5.8% of imports. Overall, January’s category distribution highlights a stable import mix, with volumes concentrated in a limited number of core categories amid ongoing trade uncertainty.
Figure 4: January 2025–January 2026 Comparison of U.S. Total and Chinese TEU Container Volume Relative to Chinese Import Record

Source: Descartes Datamyne
China-origin volumes rebound across most major U.S. ports in January.
In January 2026, China-origin container volumes across the top 10 U.S. ports increased by 60,274 TEUs, a 9.1% month-over-month gain (see Figure 5), marking a broad-based rebound following December. Port-level performance was largely positive, with gains across eight of the top 10 gateways. Houston recorded the largest percentage increase, rising 54.4% (18,295 TEUs), while New York/Newark posted a 16.7% gain (12,692 TEUs). Growth was also observed at Long Beach (6.5%), Los Angeles (3.0%), Savannah (6.6%), Oakland (14.5%), Tacoma (7.3%), and Seattle (22.2%). The two ports that did not participate in the January expansion were Charleston, down 5.2% (1,224 TEUs) and Norfolk, down 3.4% (695 TEUs). Overall, January’s increase could reflect a meaningful recovery in China-origin volumes across most major ports, signaling renewed import activity at the start of the year despite ongoing trade uncertainty.
Figure 5: December 2025 to January 2026 Comparison of top U.S. Ports for Imports Originating from China

Source: Descartes Datamyne
Top countries of origin (CoO) volumes increase in January, led by China and India.
In January 2026, U.S. containerized imports from the top 10 CoO increased 7.0% month-over-month, with a combined gain of 109,036 TEUs (see Figure 6). Growth was led by China, which rose 9.3% (65,304 TEUs), and India, which increased 22.0% (18,643 TEUs). Vietnam also posted a solid gain of 4.8% (13,337 TEUs), while Thailand increased 8.6% (9,533 TEUs) and Hong Kong rose 9.9% (6,267 TEUs). Additional growth was observed from Indonesia (5.4%), Taiwan (5.4%), and Japan (1.7%). Declines were limited to two countries: Italy, which fell 16.4% (9,495 TEUs), and South Korea, which edged down 1.7% (1,535 TEUs). Overall, January’s increase reflects broad-based strength across major sourcing countries, with renewed momentum in China- and India-origin volumes.
Figure 6: December 2025 to January 2026 Comparison of U.S. Import Volumes from Top 10 Countries of Origin

Source: Descartes Datamyne
China-led declines continue to weigh on year-over-year CoO volumes.
In January 2026, U.S. containerized imports from the top 10 countries of origin declined 9.0% year-over-year, with a combined decrease of 164,692 TEUs (see Figure 7). The contraction was driven overwhelmingly by China, which fell 22.7% (226,816 TEUs) and more than accounted for the total net decline among top CoO. Additional year-over-year decreases were recorded from Italy (14.9%), South Korea (7.1%), Taiwan (7.6%), Japan (2.4%), India (1.2%), and Hong Kong (0.8%). In contrast, several Southeast Asian origins posted strong year-over-year growth. Thailand increased 36.5% (32,251 TEUs), Vietnam rose 17.8% (43,862 TEUs), and Indonesia increased 18.0% (9,319 TEUs). January’s results likely reinforce the ongoing divergence in sourcing patterns, with expanding volumes from Southeast Asia continuing to offset a portion of the sustained decline in China-origin imports, but not enough to reverse the broader year-over-year contraction among top CoO.
Figure 7: January 2025 to January 2026 Comparison of U.S. Import Volumes from Top 10 Countries of Origin

Source: Descartes Datamyne™
Coast-to-coast import shares shift slightly in January, West Coast still leads
In January 2026, U.S. container import shares shifted modestly from December levels (see Figure 8). East and Gulf Coast ports increased their share to 40.8%, up from 39.3% in December, while West Coast ports’ share eased to 43.4%, down from 44.0% the prior month. Despite the month-over-month shift, West Coast ports continued to handle a larger share of imports than East and Gulf Coast gateways. The top 10 U.S. ports accounted for 84.2% of total containerized imports in January, up from 83.3% in December. Overall, the January changes reflect a modest rebalancing of import flows, with coast-to-coast shares remaining within the narrow range observed throughout 2025, underscoring a broadly stable national distribution of U.S. container imports.
Figure 8: Volume Analysis for Top Ports, West Coast Ports and East and Gulf Coast Ports

Source: Descartes Datamyne™
Port delays remain stable with slight adjustments.
In January 2026, average port transit delays showed uneven but modest changes across U.S. gateways compared with December (see Figure 9). On the West Coast, conditions improved at several major ports, with Los Angeles delays declining from 3.2 to 3.0 days, Long Beach improving from 4.5 to 2.8 days, and Oakland easing from 4.6 to 4.1 days. In contrast, Pacific Northwest ports experienced rising delays, as Tacoma increased from 3.8 to 5.0 days and Seattle edged higher to 7.8 days. Across the East Coast, results were mixed. New York/New Jersey delays jumped from 5.4 to 6.4 days, while Norfolk improved slightly from 5.1 to 5.0 days. Savannah and Charleston both saw delays increase, rising to 5.8 and 5.5 days, respectively, and Houston delays climbed from 5.9 to 6.6 days. Overall, January’s data indicates no signs of widespread congestion.
Figure 9: Monthly Average Transit Delays (in days) for the Top 10 Ports (Nov. 2025 – Jan. 2026)

Source: Descartes Datamyne™
Note: Descartes’ definition of port transit delay is the difference as measured in days between the Estimated Arrival Date, which is initially declared on the bill of lading, and the date when Descartes receives the U.S. Customs and Border Protection (CBP) processed bill of lading data.
Trusted by
Global Shipping Report Archive
Stay informed with monthly shipping insights with the Global Shipping Report

Director, Industry Strategy, Global Trade Intelligence, Descartes

January brings a strong recovery in Gulf Coast container imports.
In January 2026, Gulf Coast container imports totaled 237,813 TEUs, an 18.9% month-over-month increase (see Figure 10). January volumes moved 6.5% above the rolling 12-month average of 223,262 TEUs, signaling a meaningful recovery relative to recent trends. The January rebound reverses the softness observed at the end of 2025 suggesting a reacceleration of Gulf Coast import activity at the start of the year.
Figure 10: February 2025 to January 2026 U.S. Gulf Coast Container Imports

Source: Descartes Datamyne™
Transatlantic trade uncertainty adds pressure to global shipping dynamics.
In late January, European lawmakers announced they would suspend approval of a major U.S.–EU trade agreement amid escalating tensions over U.S. tariff threats tied to Greenland, highlighting rising transatlantic trade friction that could reverberate through global supply chains and shipping activity. The agreement, originally struck in July 2025 to lower tariffs and strengthen economic ties between the U.S. and EU, now faces indefinite delay as European Parliament members debate the long-term ramifications of the deal. This development adds another layer of policy uncertainty to international trade flows at a time when containerized imports and sourcing patterns are already adjusting to broader tariff and geopolitical pressures.
New U.S.–India trade agreement could support higher bilateral trade volumes.
In early February, the U.S. and India announced an agreement to cut U.S. tariffs on Indian goods from about 25% to 18%, marking a step toward easing trade tensions between the two countries. While some high tariffs on strategic products will remain, the deal signals a potential boost to U.S.–India trade activity. This development could influence global shipping patterns and supply chains as firms adjust sourcing and export strategies.
Expanded tariff authority targets countries linked to Cuban oil trade.
In late January, the U.S. government issued a new executive order under the International Emergency Economic Powers Act (IEEPA) that authorizes the potential imposition of tariffs on goods from any country that directly or indirectly supplies oil to Cuba. The move could have broader implications for trade relationships, particularly with key energy suppliers like Mexico, and underscores the evolving use of national security powers in trade policy.
U.S.–Iran tensions raise maritime risk in key shipping lanes.
Recent friction between the U.S. and Iran has renewed concerns over maritime security in the Middle East, particularly around the Strait of Hormuz. Reports of Iranian naval activity and drone incidents near commercial and U.S.-flagged vessels highlight the ongoing risk of disruption in one of the world’s most critical energy shipping corridors. While shipping traffic continues to flow, any escalation could increase insurance costs, alter vessel routing, and heighten volatility for tanker and container movements transiting the Gulf, reinforcing the sensitivity of global maritime trade to geopolitical developments in the region.
Red Sea route reopening could reshape global shipping dynamics in 2026.
Industry attention is turning to the potential reopening of the Red Sea and Suez Canal corridor in 2026, a development that could sharply reshape global trade routes and market dynamics after two years of diversions around Africa. Leading carriers have begun testing return sailings and redirecting services through the Suez Canal, signaling growing confidence in improved security conditions, though broader normalization remains cautious and contingent on sustained stability. If major lines resume regular traffic through the Red Sea, the shift could shorten voyage distances, cut operational costs, and release capacity absorbed by longer detours. In an environment already marked by excess vessel capacity, any capacity released through shorter routings could add further downward pressure on freight rates. At the same time, uneven reopening and continued risk may delay full network resets, keeping 2026 volatile for maritime trade planning and freight rate outlooks.
U.S.–China trade measures remain stable, with longer-term risks unchanged.
In January 2026, there were no material changes to U.S.–China tariff or export control measures. Existing Section 301 tariffs and policy restrictions remain in place, and while both sides continued to signal a desire to manage tensions, the broader trade framework remains unresolved. As a result, longer-term policy risks persist, and U.S.–China trade developments continue to warrant close monitoring.
Liberation Day tariffs remain in effect as legal challenge continues.
The Liberation Day tariffs remain in force as the legal challenge to their implementation under IEEPA continues. No ruling has altered enforcement to date, and a Supreme Court decision is not expected until later in 2026. As a result, policy uncertainty for importers remains elevated, with no near-term change to tariff conditions.
Managing supply chain risk: what to watch in 2026.
In January 2026, U.S. container imports rebounded to 2.32M TEUs, reflecting a typical post-holiday recovery following December’s slowdown. While volumes remained 6.8% lower year-over-year, January imports exceeded the historical average for the month, suggesting a more normalized trade environment shaped by steady demand rather than frontloading activity. China-origin imports strengthened month-over-month, rising 9.3% and regaining share after late-2025 softness, though volumes remained well below prior-year levels. At the same time, sourcing diversification continued, with sustained growth from Southeast Asian origins partially offsetting China-led year-over-year declines.
Entering 2026, global shipping conditions remain influenced more by policy and geopolitical risk than by operational disruption. Transatlantic trade uncertainty increased as the EU moved to suspend approval of a proposed U.S.–EU trade agreement, while new U.S. tariff authority targeting countries linked to Cuban oil trade expanded potential exposure across select trade corridors. Elevated U.S.–Iran tensions continue to heighten maritime risk around key Middle East shipping lanes, and uncertainty around the timing and durability of any Red Sea reopening persists. Together, these factors reinforce a cautious global trade outlook at the start of 2026, with supply chain planning increasingly shaped by policy risk management rather than clear growth signals. Here’s what Descartes is monitoring in the months ahead:
- Expanded tariffs and other potential ‘protectionist’ trade policies. Broader and deeper tariffs applied to a wide array of goods could compel U.S. importers to significantly re-engineer their supply chains, putting additional pressure on global logistics infrastructure. While China-origin imports rebounded month-over-month in January, volumes remain well below prior-year and peak levels, underscoring the continued influence of long-standing U.S.–China trade measures. At the same time, Liberation Day tariffs remain in force as legal challenges work their way through the courts. New U.S. tariff authority targeting countries linked to Cuban oil trade further expands the scope of potential trade disruption beyond traditional bilateral relationships, increasing policy risk across select energy and manufacturing supply chains. In addition, the EU’s move to suspend approval of a proposed U.S.–EU trade agreement has introduced renewed uncertainty into transatlantic trade, raising the risk of future retaliatory measures and complicating sourcing and routing decisions. Together, these developments reinforce a trade environment increasingly shaped by policy risk management rather than stable tariff frameworks.
- Monthly TEU volumes between 2.4M and 2.6M. This level has historically been a key pressure point for U.S. ports and inland logistics networks. January 2026 import volumes rebounded seasonally to 2.32M TEUs, up from December’s 2.23M TEUs, but remained below the 2.4M–2.6M threshold typically associated with elevated congestion risk. While the January increase reflects resilient demand and a post-holiday recovery, volumes continue to signal a more balanced operating environment rather than one driven by capacity strain.
- Port transit wait times. If they decrease, it’s an indication of improved global supply chain efficiencies or that the demand for goods and logistics services is declining. In January 2026, port transit delays showed modest and uneven changes across U.S. gateways. Several West Coast ports saw improved transit times, while delays edged higher at select East and Gulf Coast ports. Overall, transit times remained within recent ranges, with no indications of widespread congestion, pointing to broadly balanced port operations.
- The economy. The U.S. is an import-driven economy, so economic health is an important indicator of container import volumes. In its most recent meeting on January 27–28, 2026, the Federal Reserve held the federal funds rate unchanged in a range of 3.50%–3.75%, pausing after three consecutive cuts in late 2025. Recent labor market data points to slowing job growth, with private employers adding only about 22,000 jobs in January 2026 according to ADP estimates, well below typical historical levels and consensus expectations. Taken together, a cooling labor market, near-steady interest rates, and continued inflation pressures suggest a cautiously balanced economic backdrop that may temper upside risk to U.S. import volumes as consumer demand and business investment adjust to slower growth and tighter financial conditions.
- Middle East conflict and maritime security risk. While the frequency of attacks has eased, security risks in the Red Sea and surrounding Middle East shipping lanes remain elevated. Most major container carriers continue to avoid regular Suez transits, with operators signaling they are unlikely to fully reverse Cape of Good Hope routings without sustained improvements in regional security. Although limited test sailings have occurred, broader normalization remains uncertain, keeping longer transit times, higher operating costs, and added volatility in global shipping schedules in place as 2026 begins.
Consider recommendations to help minimize global shipping challenges.
January 2026 import volumes rebounded seasonally from December but remained below prior-year levels, reinforcing a more cautious and policy-driven trade environment. While U.S. port operations have remained broadly stable, ongoing tariff uncertainty, shifting sourcing patterns, and persistent geopolitical risk continue to complicate planning for importers. Recent trade policy developments have offered limited near-term clarity, while longer-term risks tied to tariffs, market access, and global security remain unresolved. Descartes continues to monitor these conditions through Descartes Datamyne™, government releases, and industry intelligence to help importers anticipate disruption, optimize logistics performance, and strengthen supply chain resilience amid an increasingly complex global trade landscape.
Short-term:
- Track implementation of new U.S. tariff authority targeting countries involved in Cuban oil trade, as well as EU actions suspending approval of a proposed U.S.–EU trade agreement, both of which could introduce new compliance requirements and disrupt select trade corridors.
- Track Middle East maritime risk beyond Red Sea routing. While Red Sea security conditions have improved marginally, most carriers continue Cape of Good Hope diversions, and elevated U.S.–Iran tensions keep risk heightened around the Strait of Hormuz, with potential implications for routing, insurance costs, and schedule reliability.
- Monitor developments in Venezuela and related sanctions enforcement, particularly for potential indirect impacts on energy markets, compliance requirements, fuel costs, and regional shipping risk.
- Model the effects of the U.S.–China trade framework, including reduced tariffs on Chinese goods and suspended retaliatory measures, while also accounting for uncertainty tied to Liberation Day tariff litigation.
- Monitor port volumes and delays to assess the possibility of trade disruptions if volumes persist within the 2.4M and 2.6M levels that have historically stressed U.S. maritime logistics infrastructure.
- Evaluate the impact of inflation and the Russia/Ukraine, Israel/Hamas, and Iran/Israel conflicts on logistics costs and capacity constraints. Ensure that key trading partners are not on sanctions lists.
Near-term:
- For companies that have cargo moving through the Suez Canal and the Strait of Hormuz, evaluate the impact of extended rerouting.
Long-term:
- Evaluate supplier and factory location density to mitigate reliance on over-taxed trade lanes and regions of the globe currently experiencing geopolitical conflict or that have the potential for conflict. Density creates economy of scale but also risk, and subsequent logistics capacity crisis highlights the downside.
Notes:
- This report uses the initial compiled release of publicly available U.S. Customs and Border Protection (CBP) Bill of Lading (BOL) data for all U.S. ports, which provides a standard, official source of data for reporting on maritime trade. This data can be subject to modification later by CBP. The modified data can be seen in Descartes Datamyne™ where U.S. maritime records are processed daily. Descartes Datamyne is ISO 9001 certified.
- In Descartes Datamyne™, twenty-foot equivalent units (TEU) are calculated using a combination of container size and weight as declared on Bills of Lading filed with U.S. Customs and Border Protection (CBP).
Subscribe to the Global Shipping Report
Stay informed with the latest shipping trends and U.S. container import logistics data every month with the Descartes Global Shipping Report
About Descartes Datamyne
Leverage the Power of Global Import and Export Trade Data
Optimize trade lanes, expand into new markets, discover alternative buyers and suppliers, as well as spot supply and demand shifts from a single integrated web-based platform to cost-effectively enhance your supply chain resilience and competitive edge.
Special Reports
2024 Top 30 U.S. Port Report
Stay informed with the annual U.S. Port Report from Descartes, ranking 2024 Maritime Port performance and trends in a year that defied expectations.
Download the 2024 Top 30 U.S. Port Report

What Companies are Doing to Tackle Escalating Global Supply Chain Challenges
Offering must-read insights for global trade, this white paper provides an overview of the key challenges facing global supply chain leaders as discovered through Descartes’ 2024 Global Trade Intelligence Survey.
Download the White Paper
How Descartes Can Help
Descartes Datamyne delivers business intelligence with comprehensive, accurate, up-to-date, import and export information.
Our multinational trade data assets can be used to trace global supply chains and our bill-of-lading trade data – with cross-references to company profiles and customs information – can help businesses identify and qualify new sources. Ask us for a free, no obligation demonstration of our data on a product or trade commodity of your choosing – and keep the custom research we create with our compliments.