The Global Shipping Report
June U.S. Container Imports Show Modest Rebound, but China Volumes Remain Depressed
Stay informed with the latest insights from the Descartes Global Shipping Report
Data for the Global Shipping Report provided by Descartes Datamyne
In June 2025, U.S. container imports rose to 2,217,675 twenty-foot equivalent units (TEUs), up 1.8% from May but 3.5% below June 2024 levels. The increase marks a stabilization in import activity after May’s sharp decline and may suggest that U.S. importers are adapting their supply chains amid ongoing trade volatility, with the pause on Liberation Day tariffs set to expire on July 9 and May’s U.S.–China 90-day trade truce set to expire on August 10, and a broader repeal of the de minimis exemption for low-value imports from all countries on the horizon. Port share dynamics also shifted notably: the top five West Coast ports regained momentum, with their market share climbing to 45.4% of the total volume for the top ports—the highest since January—while the top five East and Gulf Coast ports fell to 38.7%, reversing May’s temporary gain. Port congestion improved significantly across ports, reflecting easing pressure following May’s temporary bottlenecks.
U.S. imports from China in June edged up slightly to 639,300 TEUs, a 0.4% increase from May, but were 28.3% lower year-over-year, sustaining the steep drop that began in May under elevated tariffs and the removal of the de minimis exemption. The sharp decline followed a wave of frontloading in April as importers rushed to beat tariff deadlines—a shift explored in this Descartes analysis on pre-tariff import surges from China. China’s share of U.S. imports fell further to 28.8%, well below its July 2024 peak of 40.0%, as sourcing continues to diversify toward Southeast Asia and other regions.
Global trade conditions remain strained. Red Sea disruptions persist and are being exacerbated by the Iran–Israel conflict, prompting costly reroutes and longer transit times while ongoing trade negotiation uncertainty continues to complicate supply chain planning. In this environment, businesses must remain flexible, closely monitor geopolitical developments, and reinforce supply chain resilience as conditions evolve.
In this Article...
- toc
U.S. container imports stabilize in June after May drop.
In June 2025, U.S. container import volumes rebounded modestly to 2,217,675 TEUs, up 1.8% from May and narrowing the year-over-year decline to 3.5%. This follows May’s sharp 9.7% month-over-month drop driven by tariff volatility and shifting trade policy. Compared to June 2019, volumes are up 12.9%, indicating structural demand strength despite ongoing headwinds. Year-to-date, total imports through June are tracking 3.8% above 2024, though growth has slowed compared to earlier in the year.
Figure 1: U.S. Container Import Volume Year-over-Year Comparison
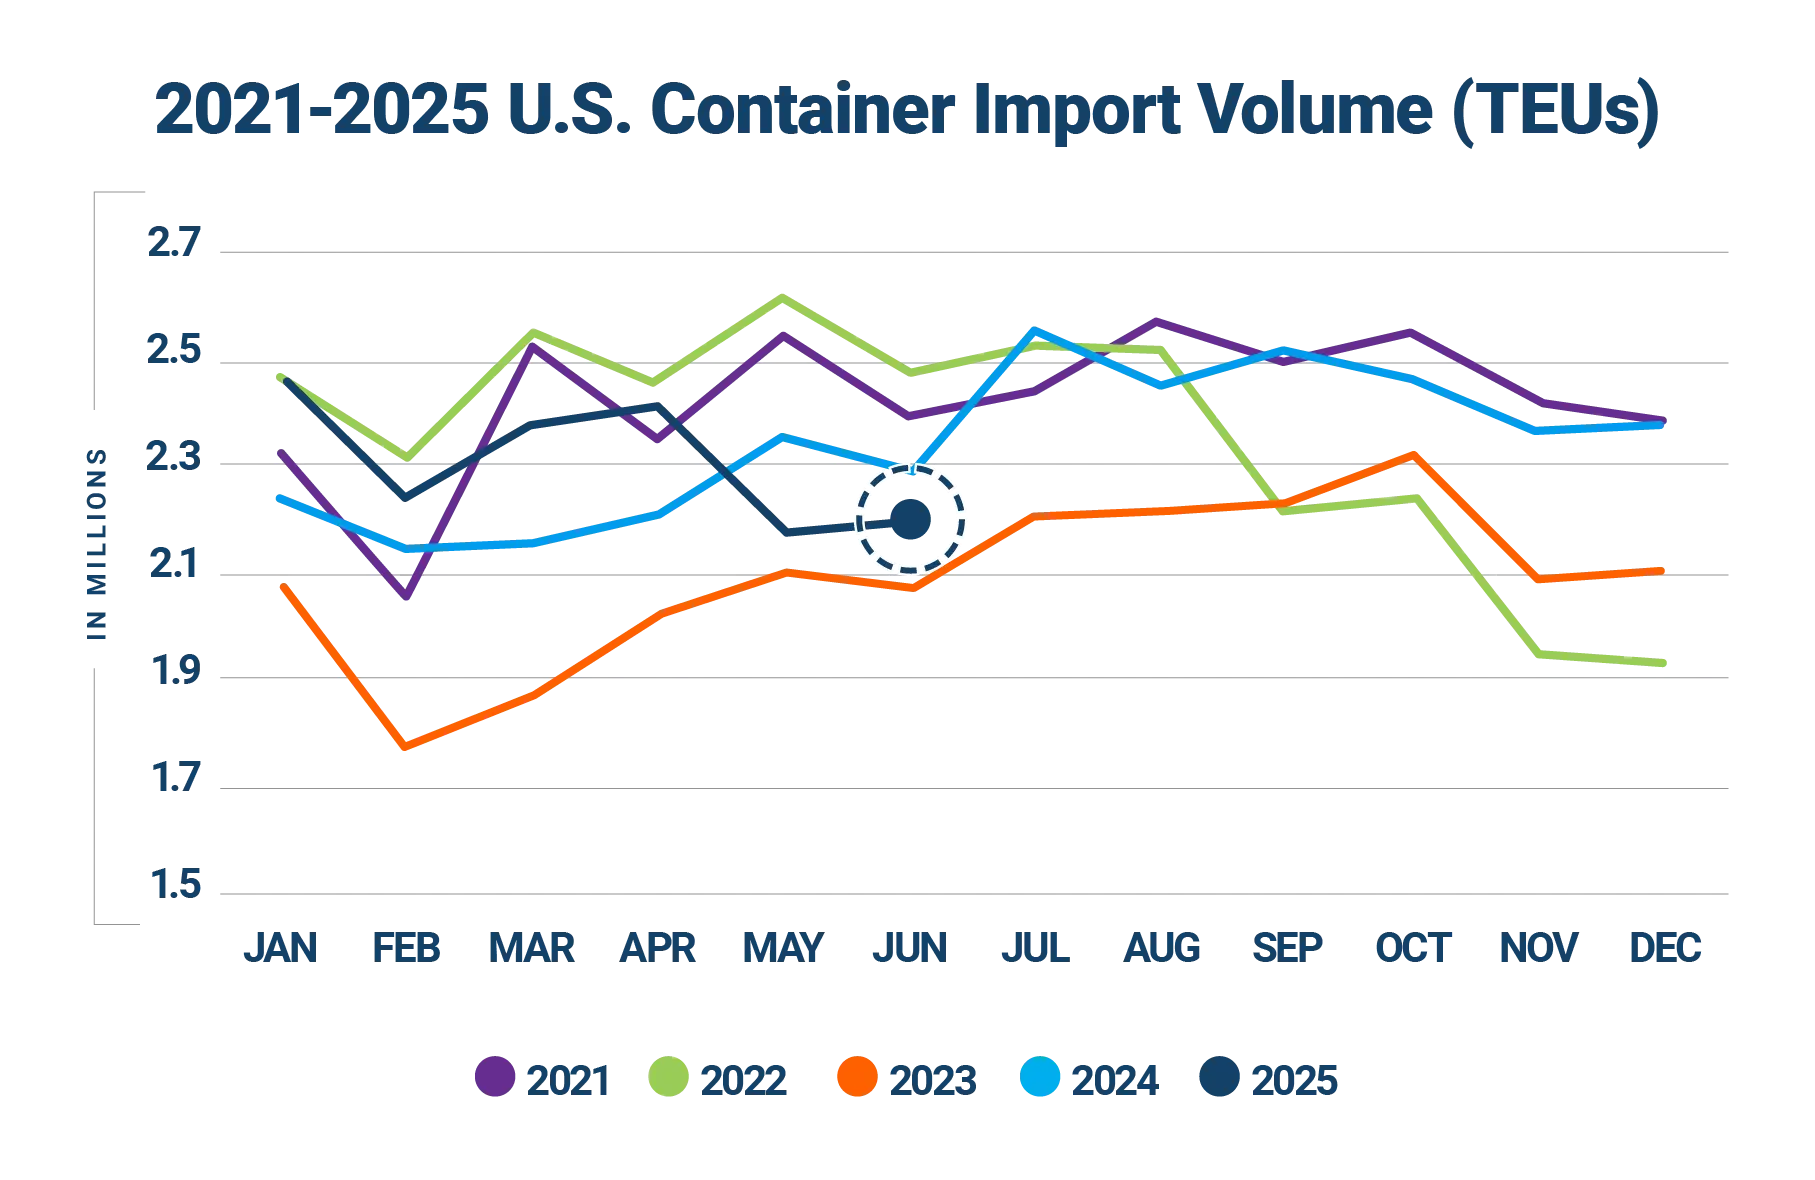
Source: Descartes Datamyne™
Seasonal trend breaks as June volumes edge upward.
Historically, June posts a decline from May, with 2020 being the only recent exception—until now (see Figure 2). In 2025, imports rose 1.8% month-over-month, breaking that pattern. This modest gain likely reflects stabilization after April frontloading and the initial shock of new tariffs, along with early effects of the May 14 U.S.–China tariff reduction agreement and the Liberation Day tariff pause on imports from nearly all countries (set to expire on July 9), which may have combined to contribute to the small recovery.
Figure 2: May to June U.S. Container Import Volume Comparison

Source: Descartes Datamyne™
Top U.S. ports show modest growth in June, led by strong West Coast gains.
In June 2025, container volumes at the top 10 U.S. ports increased 3.1% compared to the previous month, with a combined net gain of 55,733 TEUs (see Figure 3). The growth was driven by the West Coast, where Los Angeles saw a 29.1% increase (up 103,884 TEUs), Long Beach increased 18.8% (up 58,492 TEUs), and Tacoma increased 33.3% (up 16,142 TEUs). However, most other major ports experienced declines. Savannah posted the steepest loss at 16.9%, followed by Houston (-15.8%), Charleston (-14.8%), and Norfolk (-14.3%). Volumes at New York/New Jersey fell by 3.3%. This mixed performance underscores ongoing shifts in port routing and regional demand, with top West Coast gateways gaining a larger share of import volumes in June.
Figure 3: May 2025 to June 2025 Comparison of Import Volumes at Top 10 U.S. Ports

Source: Descartes Datamyne™
China-origin imports remain soft in June, with sharp declines across most major product categories.
U.S. imports from China totaled 639,300 TEUs in June 2025, nearly flat month-over-month (up 0.4%) but down 28.3% from a year earlier (see Figure 4). China’s share of total U.S. container imports hit a four-year low in June of 28.8%, reflecting the sustained impact of elevated tariffs.
The leading import categories from China in June were Furniture & Bedding (HS-94) with 96,347 TEUs, Plastics (HS-39) with 87,454 TEUs, and Nuclear Reactors & Boilers (HS-84) with 66,152 TEUs. However, these top categories also saw some of the steepest year-over-year declines, with furniture down 36.9%, nuclear reactors down 31.8%, and plastics down 17.6% versus June 2024. Other significant categories such as Electric Machinery (HS-85), Toys, Games & Sporting Goods (HS-95), and Vehicles (HS-87) experienced year-over-year drops of 33.7%, 27.1%, and 31.7%, respectively. Even top categories like Textiles (HS-63) and Apparel (HS-61, HS-62) and Footwear (HS-64) fell more than 18–29%.
The across-the-board decline underscores the broad impact of U.S. trade policy. While importers appear to be adjusting supply chains slowly as high tariffs persist and sourcing diversification continues, China’s share of U.S. imports may remain under pressure through the second half of 2025—especially with the July 9 expiration of the broader tariff pause potentially triggering a second wave of cost increases ahead of the August 10 expiration of the U.S.–China trade truce. In addition, the newly implemented 40% U.S. tariff on re-exported goods from Vietnam—aimed at curbing transshipments of Chinese products—further complicates alternative sourcing strategies, reinforcing the long-term pressure on China-origin volumes.
Figure 4: June 2024–June 2025 Comparison of U.S. Total and Chinese TEU Container Volume Relative to Chinese Import Record

Source: Descartes Datamyne
China-origin volumes rebound at key West Coast ports but decline sharply elsewhere.
At the port level, China-origin imports showed signs of recovery at select West Coast ports, while most East and Gulf Coast gateways experienced steep declines (see Figure 5). Los Angeles led gains with a 42.8% increase (56,714 TEUs) followed by Long Beach at 28.4% (44,297 TEUs). Tacoma and Seattle also saw notable increases, up 56.3% (10,277 TEUs) and 40.7% (4,188 TEUs), respectively—suggesting possible rerouting or a partial rebound in trans-Pacific flows. West Coast gains, however, were offset by large drops at key Atlantic and Gulf hubs. Savannah and Charleston reported severe declines of 44.7% and 43.2%, respectively, while Houston fell 38.4%. Norfolk and New York/Newark dropped 37.8% and 26.5%, respectively, and Oakland posted a less precipitous decline of 16.9%.
Despite growth at several West Coast ports, the total gain across the top 10 ports was just 21,550 TEUs—a modest 3.7% increase month-over-month, reflecting ongoing volatility in China-origin trade flows as sourcing shifts, rerouting strategies, and tariff policy continue to reshape the port landscape.
Figure 5: May 2025 to June 2025 Comparison of top U.S. Ports for Imports Originating from China

Source: Descartes Datamyne
U.S. imports from top 10 CoOs edge up in June amid mixed performance.
In June 2025, U.S. containerized imports from the top 10 countries of origin increased slightly, rising by 1.3% (19,544 TEUs) month-over-month (see Figure 6). While China—the dominant U.S. maritime trading partner—saw only a marginal increase of 0.4% (2,299 TEUs), several Southeast Asian nations posted more robust gains. Vietnam led in volume growth with an increase of 7.7% over May, adding 19,516 TEUs, followed by Indonesia at 17.3%, Thailand at 8.6%, and Italy at 9.0%. These figures suggest continued momentum for China-alternative sourcing strategies.
Despite the marginal overall increase, volumes were significantly weaker among other key trading partners. South Korea and India and saw sharp declines of 12.5% and 9.6%, respectively, while Japan fell 3.0%. Imports from Germany and Taiwan rose modestly by 2.6% each. The fluctuations in import volume from top CoOs underscore the ongoing global trade realignment as U.S. businesses respond to tariff shifts and cost pressures.
Figure 6: May 2025 to June 2025 Comparison of U.S. Import Volumes from Top 10 Countries of Origin

Source: Descartes Datamyne
Year-over-year CoO trends show deepening decline from China, continued growth from Southeast Asia.
In June 2025, U.S. containerized imports from the top 10 countries of origin (CoO) declined 10.5% year-over-year, driven overwhelmingly by a 28.7% plunge in volumes from China, equal to a loss of 257,003 TEUs (see Figure 7). At the same time, several Southeast Asian countries posted strong gains: Vietnam surged 27.6% year-over-year, while Indonesia jumped 57.5% and Thailand rose 15.6%. Germany also saw upside, with a 13.2% increase, while Italy posted a modest 2.9% gain. In contrast, South Korea saw a sharp 16.9% decline, while India, Japan, and Taiwan were flat or slightly negative.
Year-over-year data reinforces the ongoing reconfiguration of global sourcing networks as U.S. importers diversify suppliers. As import volumes from Southeast Asia rise and volumes from China decline, these year-over-year trends signal a sustained shift in trade flows amid evolving geopolitical and economic pressures.
Figure 7: June 2024 to June 2025 Comparison of U.S. Import Volumes from Top 10 Countries of Origin

Source: Descartes Datamyne™
West Coast ports regain market share in June as East and Gulf Coast volumes retreat.
In June 2025, top West Coast ports rebounded sharply, increasing their volume share to 45.4%, up from 38.1% in May (see Figure 8). Meanwhile, top East and Gulf Coast ports saw their share fall to 38.7%, a significant drop from the previous month’s 44.5%. The reversal suggests a partial rebalancing of trade flows reflecting the impact of the U.S.–China trade truce whereby tariffs on imports from China were reduced from the staggering 145% set in April to 30% effective mid-May. The trend also aligns with modest gains in China-origin imports, which typically enter through Pacific-facing ports. Overall, the top 10 U.S. ports handled 84.1% of total imports in June, up from 82.6% in May.
Figure 8: Volume Analysis for Top Ports, West Coast Ports and East and Gulf Coast Ports

Source: Descartes Datamyne™
Port delays improve sharply in June, led by West Coast recovery.
After mixed results in May, U.S. port transit time delays fell significantly in June, dropping from a total of 54.4 to 44.0 days across major gateways (see Figure 9). The largest improvements came at Long Beach (down 3.3 days) and Los Angeles (down 2.1 days), both of which had seen unusual congestion in May despite lower volumes from China. Seattle, previously the most delayed port, improved by 1.0 day, while Oakland and Tacoma recorded smaller gains.
East and Gulf Coast ports remained comparatively stable. Savannah, Charleston, Norfolk, and Houston all posted moderate improvements, while New York/New Jersey held steady at 5.8 days.
Figure 9: Monthly Average Transit Delays (in days) for the Top 10 Ports (Apr. 2025 – Jun. 2025)

Source: Descartes Datamyne™
Note: Descartes’ definition of port transit delay is the difference as measured in days between the Estimated Arrival Date, which is initially declared on the bill of lading, and the date when Descartes receives the CBP-processed bill of lading data.
Trusted by
Stay informed with monthly shipping insights with the Global Shipping Report
Gulf Coast imports drop sharply in June after May surge.
In June 2025, Gulf Coast container imports fell 24.8% to 192,883 TEUs, down from 256,491 TEUs in May (see Figure 10). The steep decline erased the gains seen in the previous three months and brought volumes 15.1% below the rolling 12-month average of 227,316 TEUs. The June downturn suggests that Gulf Coast gateways, while previously more insulated from tariff-related volatility, are now also feeling the effects of shifting trade dynamics. Tariff uncertainty may have contributed to weaker inbound flows even at traditionally stable ports.
Figure 10: July 2024 to June 2025 U.S. Gulf Coast Container Imports

Source: Descartes Datamyne™
U.S.–China trade talks continue ahead of August deadline.
As of July 2025, the U.S.–China trade relationship remains in a fragile truce. After U.S. tariffs spiked to 145% in April, both sides agreed in mid-May to a 90-day reduction—lowering U.S. duties to 30%, effective May 14 and set to expire August 10.
In late June, both countries advanced a framework agreement to implement May’s Geneva consensus, including expedited rare earth exports from China and eased U.S. restrictions on chip software and ethane shipments. Despite progress, key disputes—like IP protection, tech transfer, and industrial subsidies—remain unresolved. Analysts warn that without deeper agreement, renewed tensions and supply chain disruption could return.
Red Sea shipping disruptions worsen amid Iran–Israel conflict and persistent Houthi threats.
As of July 2025, instability in the Red Sea remains unresolved due to ongoing Houthi attacks and escalating Iran–Israel tensions, which have intensified security concerns across key maritime corridors. The conflict has raised risks in adjacent waterways, including the Strait of Hormuz, prompting additional caution and rerouting by global shipping lines. Fears of escalation have led some cargo carriers to avoid transiting the region altogether, exacerbating existing bottlenecks in the Red Sea and Gulf areas.
Major carriers continue to reroute vessels around the Cape of Good Hope, extending transit times by up to two weeks and driving up costs along Asia–Europe and Asia–U.S. East Coast lanes. Traffic through the Bab el-Mandeb Strait remains nearly 50% below early 2024 levels, tightening capacity and further straining global supply chains.
Managing supply chain risk: what to watch in 2025.
In June 2025, U.S. container imports posted a modest rebound, but volumes from China remained depressed, up just 0.4% from May and down 28.3% year-over-year. Although the temporary U.S.–China tariff reduction agreement continues to offer partial relief, its August expiration leaves significant uncertainty in play. The revocation of the de minimis exemption for low-value Chinese shipments continues to increase costs and compliance burdens, especially for ecommerce importers—and under current legislation, this duty-free privilege will be eliminated for all countries by July 1, 2027, further raising the long-term cost of low-value global sourcing. Meanwhile, disruptions in the Red Sea persist, and ongoing conflict in Eastern Europe, coupled with sanctions, continues to pressure global trade corridors. With tariffs in flux, geopolitical risks escalating, and logistical vulnerabilities exposed, importers face sustained challenges. Here’s what Descartes will be closely monitoring in the months ahead:
- Expanded tariffs and other potential ‘protectionist’ trade policies. Broader and deeper tariffs applied to a wide array of goods could compel U.S. importers to significantly re-engineer their supply chains, putting additional pressure on global logistics infrastructure. While U.S. tariffs on Chinese imports peaked at 145% in April, a temporary 90-day reduction to 30% took effect on May 14. Imports from China surged in April due to frontloading, then dropped 20.8% in May and held flat in June as importers adjusted to the new rates. Adding to the cost burden, the de minimis exemption was revoked on May 2, triggering a 120% duty or US$100 fee per parcel—partially eased mid-May with a revised 54% rate. With the broader Liberation Day tariff pause set to expire July 9 and the U.S.–China tariff truce ending August 10, importers face rising pressure to rethink sourcing strategies and build resilience amid tightening enforcement and geopolitical risk.
- Monthly TEU volumes between 2.4M and 2.6M. This level remains a key pressure point for U.S. ports and inland logistics networks. In June 2025, U.S. container import volumes rose modestly to 2.22 million TEUs, up from May but still well below the 2.4–2.6 million TEU range that typically signals infrastructure strain. The earlier May dip reflected tariff-driven pullbacks and sourcing adjustments, while June’s rebound suggests stabilization rather than full recovery.
- Port transit wait times. If they decrease, it’s an indication of improved global supply chain efficiencies or that the demand for goods and logistics services is declining. In June 2025, port transit delays declined across most major U.S. ports, with the sharpest improvements at Los Angeles and Long Beach, signaling that congestion has eased following May’s temporary spike.
- The economy. The U.S. is an import-driven economy, so economic health is an important indicator of container import volumes. In June 2025, the U.S. labor market showed moderate resilience, with 147,000 jobs added and the unemployment rate edging down to 4.1%. However, private-sector gains slowed to 74,000—the weakest pace since late 2024—and manufacturing employment declined for a second straight month. At its June 18 meeting, the Federal Reserve held interest rates steady at 4.25%–4.50% for the fourth consecutive time, citing persistent inflation and ongoing economic uncertainty. With trade policy still evolving and signs of softening in key labor segments, businesses face a more cautious economic outlook heading into the second half of 2025.
- Middle East conflict. Houthi-related threats continue to divert carriers from the Suez Canal, extending transit times and raising shipping costs as vessels reroute around the Cape of Good Hope. Although a ceasefire was declared earlier in the year, it has since broken down, with renewed attacks on commercial vessels reported in late April. Tensions have been further inflamed by the escalating conflict between Israel and Iran, which has increased security risks across the broader Middle East maritime corridor—including the Strait of Hormuz and Red Sea region. In response to continued Houthi aggression, the U.S. has launched additional airstrikes on targets in Yemen. As a result of ongoing instability in the area, carriers have not resumed Red Sea transits, maintaining costly detours that impact Asia–U.S. East Coast and Europe-bound trade. While East and Gulf Coast port operations remain stable for now, further escalation could lead to broader supply chain disruptions and growing pressure on global trade flows.
Consider recommendations to help minimize global shipping challenges.
In June 2025, U.S. container import volumes rose slightly after May’s steep decline, but the impact of recent tariff changes continued to influence trade flows. Port transit delays decreased across most major U.S. gateways, with substantial recovery at Los Angeles and Long Beach. Meanwhile, the ongoing Red Sea crisis, tariff enforcement on transshipped goods, and mixed economic signals are adding new challenges to global shipping operations. Descartes continues to monitor these evolving conditions using Descartes Datamyne, supplemented by government and industry data, to support importers in managing risks and strengthening supply chain resilience in today’s complex trade environment.
Short-term:
- Consider modelling the impacts of increased tariffs on imported goods, especially with two key trade deadlines approaching: the July 9 expiration of the Liberation Day tariff pause and the August 10 expiration of the U.S.–China tariff truce.
- Monitor port volumes and delays to assess the possibility of trade disruptions if volumes are within 2.4M and 2.6M levels that have historically stressed U.S. maritime logistics infrastructure.
- Track the Middle East conflict as carriers avoid the Red Sea amid Houthi threats, failed ceasefires, and rising Iran–Israel tensions.
- Evaluate the impact of inflation and the Russia/Ukraine, Israel/Hamas, and Iran/Israel conflicts on logistics costs and capacity constraints. Ensure that key trading partners are not on sanctions lists.
Near-term:
- For companies that have cargo moving through the Suez Canal and the Strait of Hormuz, evaluate the impact of extended rerouting caused by Middle East conflicts.
Long-term:
- Evaluate supplier and factory location density to mitigate reliance on over-taxed trade lanes and regions of the globe that have the potential for conflict. Density creates economy of scale but also risk, and subsequent logistics capacity crisis highlights the downside. Conflicts do not happen “overnight” so now is an optimal time to address this potentially business disrupting issue.
Notes:
- U.S. tariff rates cited in this report were current as of 4pm ET on July 7, 2025.
- This report uses the initial compiled release of publicly available U.S. Customs and Border Protection (CBP) Bill of Lading (BOL) data for all U.S. ports, which provides a standard, official source of data for reporting on maritime trade. This data can be subject to modification later by CBP. The modified data can be seen in Descartes Datamyne™ where U.S. maritime records are processed daily. Descartes Datamyne is ISO 9001 certified.
- In Descartes Datamyne™, twenty-foot equivalent units (TEU) are calculated using a combination of container size and weight as declared on Bills of Lading filed with U.S. Customs and Border Protection (CBP).
Subscribe to the Global Shipping Report
Stay informed with the latest shipping trends and U.S. container import logistics data every month with the Descartes Global Shipping Report
About Descartes Datamyne
Leverage the Power of Global Import and Export Trade Data
Optimize trade lanes, expand into new markets, discover alternative buyers and suppliers, as well as spot supply and demand shifts from a single integrated web-based platform to cost-effectively enhance your supply chain resilience and competitive edge.
Special Reports
2024 Top 30 U.S. Port Report
Stay informed with the annual U.S. Port Report from Descartes, ranking 2024 Maritime Port performance and trends in a year that defied expectations.
Download the 2024 Top 30 U.S. Port Report

What Companies are Doing to Tackle Escalating Global Supply Chain Challenges
Offering must-read insights for global trade, this white paper provides an overview of the key challenges facing global supply chain leaders as discovered through Descartes’ 2024 Global Trade Intelligence Survey.
Download the White Paper
How Descartes Can Help
Descartes Datamyne delivers business intelligence with comprehensive, accurate, up-to-date, import and export information.
Our multinational trade data assets can be used to trace global supply chains and our bill-of-lading trade data – with cross-references to company profiles and customs information – can help businesses identify and qualify new sources. Ask us for a free, no obligation demonstration of our data on a product or trade commodity of your choosing – and keep the custom research we create with our compliments.