The Global Shipping Report
September U.S. Container Imports Contract Amid Tariff Uncertainty
Stay informed with the latest insights from the Descartes Global Shipping Report
Data for the Global Shipping Report provided by Descartes Datamyne
In September 2025, U.S. container imports totaled 2,307,933 Twenty-foot Equivalent Units (TEUs), down 8.4% from August and 8.4% below September 2024. This total represents the third-highest September on record, and volumes for the first nine months of the year are tracking 1.9% higher than the same period in 2024, suggesting moderate resilience in overall demand. China-origin imports fell to 762,772 TEUs, down 12.3% month-over-month and 22.9% year-over-year, reversing the short-lived rebound observed in July and August, and highlighting importer sensitivity to tariff policy. Port transit delays showed mixed results in September with a modest, overall improvement, indicating that U.S. ports continue to manage throughput effectively.
Major carriers continue to bypass the Red Sea and reroute around the Cape of Good Hope, extending Suez-linked schedules by one to two weeks. The Liberation Day tariffs remain active but under legal pressure, with an appeals court ruling now under review by the U.S. Supreme Court. At the same time, the U.S. government shutdown has delayed key economic data releases and slowed regulatory processes tied to trade compliance, adding another layer of uncertainty. New Section 301 vessel fees taking effect October 14 may also raise shipping costs for Chinese-built or Chinese-operated vessels, further complicating import planning. Combined with the November 10 expiration of the U.S.–China tariff truce, these factors keep trade policy risk elevated and planning complex, even as U.S. ports continue to demonstrate resilience under sustained volumes.
In this Article...
- toc
U.S. container imports decline in September, though remain relatively strong year-to-date.
In September 2025, U.S. container import volumes totaled 2,307,933 TEUs, down 8.4% from September 2024 (see Figure 1). The pullback followed two months of elevated volumes and places September as the fifth-highest monthly total this year. On a year-to-date basis, volumes through September are tracking 1.9% ahead of the same period in 2024, underscoring the potential impact of frontloading earlier in the year and relatively resilient overall demand despite persistent policy and economic uncertainty.
Figure 1: U.S. Container Import Volume Year-over-Year Comparison
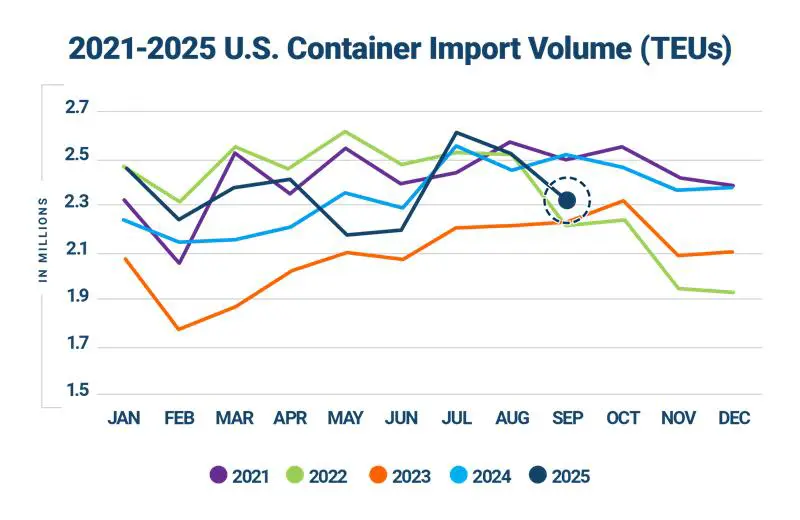
Source: Descartes Datamyne™
September 2025 import volumes fell 8.4% (211,789 TEUs) over August (see Figure 2), in keeping with the pattern of a month-over-month decrease observed in eight of the last 10 years. While September volumes have traditionally declined over August, the steeper month-over-month drop this year potentially highlights heightened sensitivity to tariff deadlines as importers continue to adjust shipment flows in response to policy changes. Even so, September 2025 ranks as the third-highest September on record, trailing only September 2024 (2,520,935 TEUs) and September 2021 (2,489,942 TEUs)—highlighting that, despite the recent decline, overall import activity remains relatively strong.
Figure 2: August to September U.S. Container Import Volume Comparison

Source: Descartes Datamyne™
Volumes at top 10 U.S. ports soften in September.
In September 2025, container volumes at the top 10 U.S. ports declined by 7.9% month-over-month, with a combined loss of 169,455 TEUs (see Figure 3). Most major gateways experienced contractions, led by more significant drops at Long Beach (11.4%), Baltimore (12.6%), and Savannah (9.1%). Volumes also fell at Los Angeles (7.6%), New York/New Jersey (8.6%), Charleston (7.6%), Norfolk (6.2%), and Oakland (6.4%). Houston decreased modestly, down 2.0%. In contrast, Tacoma was the only port to record growth, rising 4.7% month-over-month. The results across the top 10 ports highlight seasonal influences while also signaling potential caution from importers navigating tariff volatility.
Figure 3: August 2025 to September 2025 Comparison of Import Volumes at Top 10 U.S. Ports

Source: Descartes Datamyne™
China-origin imports decline sharply in September.
U.S. containerized imports from China fell to 762,772 TEUs in September 2025, down 12.3% month-over-month, 22.9% year-over-year, and 25.4% compared to the record July 2024 level of 1,022,913 TEUs (see Figure 4). China’s share of total U.S. imports slid to 33.0% in September from 34.5% in August.
Year-over-year declines were widespread across China’s leading import categories, with many registering losses of more than 20%. Aluminum and articles thereof (HS-76) posted the steepest contraction, down 43.8%. Toys and sporting goods (HS-95) dropped 32.8%, footwear (HS-64) 33.9%, and electric machinery (HS-85) 31.5%. Apparel categories also weakened sharply, with knit apparel (HS-61) down 31.9% and non-knit apparel (HS-62) down 29.1%. Articles of iron or steel (HS-73) decreased 24.6%, vehicles (HS-87) 23.5%, and glassware (HS-70) 28.3%.
Furniture and bedding (HS-94), the largest import category from China, fell 22.3% year-over-year, though it maintained a 14.5% share of all China-origin imports. In contrast, plastics (HS-39) were comparatively resilient, slipping only 1.5% while growing their share to 13.5% of the total.
September’s decline reflects broad-based weakness across nearly all major categories, underscoring the combined impact of seasonal softening and tariff-related caution. With the 90-day tariff truce set to expire in mid-November, China’s share of U.S. imports remains sensitive to both policy outcomes and underlying market dynamics.
Figure 4: September 2024–September 2025 Comparison of U.S. Total and Chinese TEU Container Volume Relative to Chinese Import Record

Source: Descartes Datamyne
China-origin imports drop across most top ports in September.
In September 2025, China-origin imports across the top 10 U.S. ports declined by 94,852 TEUs, an 11.6% month-over-month decrease (see Figure 5). West Coast gateways drove much of the pullback, led by Long Beach (16.4%), Oakland (11.2%), Los Angeles (5.7%), and Seattle (29.0%). On the East Coast, New York/Newark fell sharply by 22.1%. Norfolk also contracted significantly, down 15.0%, while Savannah slipped 10.6% and Charleston eased 3.0%. Gulf Coast activity stabilized, with Houston inching up 0.8%. Tacoma was the only West Coast port to record growth, rising 5.3%. The declines across both coasts reflect the easing demand for China-origin imports.
Figure 5: August 2025 to September 2025 Comparison of top U.S. Ports for Imports Originating from China

Source: Descartes Datamyne
Imports from top CoO drop month-over-month as Asian trade momentum slows.
In September 2025, U.S. containerized imports from the top 10 CoO fell 9.4% month-over-month—a combined decline of 169,126 TEUs (see Figure 6). The decrease was led by China, which dropped 106,751 TEUs (12.3%). Significant declines were also recorded from Italy (15.1%), South Korea (14.1%), Germany (11.6%), Hong Kong (11.2%), and Taiwan (10.2%). Vietnam and Thailand posted smaller pullbacks of 2.9% and 3.5%, respectively, while India fell 5.2%. Indonesia was nearly flat, easing by just 0.2%.
The broader contraction in September was more than double August’s 4.4% decline, with weakness spreading across nearly all top CoO. The results highlight both the outsized impact of China’s pullback and softening trade momentum among several key Asian partners.
Figure 6: August 2025 to September 2025 Comparison of U.S. Import Volumes from Top 10 Countries of Origin

Source: Descartes Datamyne
Year-over-year CoO volumes fall sharply as China drives overall contraction.
In September 2025, U.S. containerized imports from the top 10 CoO fell 12.0% year-over-year with a combined loss of 223,521 TEUs (see Figure 7). The decline was led by China, which dropped 226,653 TEUs (22.9%). Additional sharp pullbacks came from South Korea (17.3%), Taiwan (18.1%), and Hong Kong (11.8%), with smaller decreases from Germany (4.4%) and Italy (2.5%). In contrast, several Southeast and South Asian origins continued to expand market share. Indonesia grew 18.6% year-over-year, while Thailand rose 11.5%, Vietnam 7.0%, and India 5.2%. September’s losses erased the modest 0.7% growth recorded in August, underscoring how China’s volatility continues to shape overall U.S. import dynamics even as diversification toward South and Southeast Asia persists.
Figure 7: September 2024 to September 2025 Comparison of U.S. Import Volumes from Top 10 Countries of Origin

Source: Descartes Datamyne™
East and Gulf ports up, West Coast ports down.
In September 2025, port shares shifted only modestly from August (see Figure 8). East and Gulf Coast ports increased their market share to 41.3% (up 0.5%), while West Coast ports eased to 43.9% (down 0.2%). The top 10 ports together handled 85.2% of total volumes, a slight increase from 84.9% in August.
This marks the third consecutive month of share gains for East and Gulf Coast ports after dipping below 40% in July, while West Coast ports have gradually given back share since peaking at 46.8% in January. Overall, both coasts remain within this year’s typical volume ranges, underscoring a broadly stable balance in the coast-to-coast mix.
Figure 8: Volume Analysis for Top Ports, West Coast Ports and East and Gulf Coast Ports

Source: Descartes Datamyne™
Port delays show mixed results with overall minor improvement in September.
In September 2025, port transit time delays showed mixed results with overall minor improvement as import volumes declined from August (see Figure 9). On the West Coast, Long Beach (1.2 days), Oakland (0.9 days), and Seattle (0.4 days) experienced decreases in delays, while Los Angeles saw a small increase (0.3 days) and Tacoma held steady. On the East and Gulf Coasts, New York/New Jersey (0.5 days) and Norfolk (1.1 days) improved, while Charleston and Savannah showed little change, and Houston recorded a modest increase (1.0 day). Overall, major U.S. ports continued to process throughput efficiently, with no signs of significant congestion.
Figure 9: Monthly Average Transit Delays (in days) for the Top 10 Ports (Jul. 2025 – Sep. 2025)

Source: Descartes Datamyne™
Note: Descartes’ definition of port transit delay is the difference as measured in days between the Estimated Arrival Date, which is initially declared on the bill of lading, and the date when Descartes receives the CBP-processed bill of lading data.
Trusted by
Stay informed with monthly shipping insights with the Global Shipping Report

Director, Industry Strategy, Global Trade Intelligence, Descartes

Gulf Coast imports decline for second month.
In September 2025, Gulf Coast container imports declined to 216,206 TEUs, down 4.9% from August’s 227,401 TEUs and marking the second straight month of contraction following July’s rebound (see Figure 10). Volumes were 5.8% below the rolling 12-month average of 229,624 TEUs, pointing to modest seasonal cooling.
Figure 10: October 2024 to September 2025 U.S. Gulf Coast Container Imports

Source: Descartes Datamyne™
Ongoing U.S. government shutdown introduces additional uncertainty for importers.
While core U.S. Customs and Border Protection (CBP) functions remain operational, ancillary reviews and regulatory clearances from agencies such as the Food and Drug Administration (FDA), the U.S. Department of Agriculture (USDA), and the Environmental Protection Agency (EPA) may face staffing gaps, creating risks of shipment delays for regulated goods. Licensing and classification services at the U.S. Department of Commerce (DOC) and the U.S. Department of State (DOS) are also likely to slow, affecting products requiring export or import controls. Beyond the operational level, the shutdown has already delayed key federal economic data releases, complicating business and policy planning. Though container import flows at ports remain steady, prolonged disruption could build backlogs and raise compliance uncertainty, adding another layer of risk to supply chain planning.
Tariff freeze holds as U.S.–China talks continue.
The U.S.–China tariff truce remains in effect through November 10, 2025, keeping duties on Chinese goods capped at roughly 30% and averting new escalations during the critical holiday shipping season. While talks have yielded only narrow relief, fundamental disputes over intellectual property, technology transfer, and state subsidies remain unresolved. The pause provides importers short-term stability but the outlook beyond November is uncertain, with negotiations determining whether the truce evolves into a broader agreement or collapses into renewed tariff escalation.
Liberation Day tariffs remain in force amid court challenge.
Liberation Day tariffs continue, albeit under significant legal pressure. On August 29, 2025, the U.S. Court of Appeals for the Federal Circuit affirmed a lower court’s ruling that many of the tariffs imposed via the International Emergency Economic Powers Act (IEEPA) exceeded presidential authority—but stayed its own judgment until October 14 to allow time for further appeal. Because of this stay, the tariffs currently remain enforceable while the litigation proceeds. The case has drawn an appeal toward the Supreme Court for resolution. Facing an unclear tariff outlook, importers are likely to prioritize frontloading shipments and supply chain diversification.
New Section 301 vessel fees could increase shipping costs and clearance risks.
Effective October 14, 2025, new vessel fees established under the Federal Register Notice will apply to vessels owned, operated, or built in China, as well as foreign-built vehicle carriers. The fees range from $14 to $50 per net ton (or $120 per container discharged) depending on vessel type, with Liquified Natural Gas (LNG) tankers exempt. These new charges could raise shipping costs for goods arriving on affected vessels and add administrative complexity for importers reliant on carriers subject to the fees. Delays in fee verification or payment could temporarily disrupt unloading or clearance, especially for high-volume trade lanes involving Chinese-built or Chinese-operated vessels.
Houthi attacks continue and maritime rerouting persists.
Disruptions through the Red Sea corridor have carried into October, with a missile attack on the Dutch-flagged Minervagracht in the Gulf of Aden on September 29. This attack extends Houthi operations beyond traditional Red Sea limits, underscoring the persistent threat to maritime routes. Many carriers continue to bypass Suez entirely, routing via the Cape of Good Hope, adding 9–14 days (or more) to Asia–Europe and Asia–U.S. East Coast services. According to recent assessments, traffic through the Red Sea/Suez system remains sharply reduced relative to pre-crisis norms and, while some tankers are cautiously reentering the corridor, most container services maintain alternate routing.
Managing supply chain risk: what to watch in 2025.
In September 2025, U.S. container imports decreased to 2.31M TEUs—just below the 2.4M–2.6M TEU range that has historically defined peak demand levels. China-origin volumes fell 12.3% from August and 22.9% year-over-year, highlighting importers’ sensitivity to tariff policy. While the U.S.–China tariff truce continues to cap duties at 30% through November 10, reciprocal tariffs on more than 60 countries remain enforceable despite legal challenges now before the Supreme Court, adding uncertainty to trade planning. The ongoing U.S. government shutdown has further complicated the outlook by delaying economic data releases and slowing regulatory processes tied to trade compliance. At the same time, Red Sea risks persist, keeping most carriers on Cape of Good Hope routes that extend transit times by up to two weeks. Here’s what Descartes is monitoring in the months ahead:
- Expanded tariffs and other potential ‘protectionist’ trade policies. Broader and deeper tariffs applied to a wide array of goods could compel U.S. importers to significantly re-engineer their supply chains, putting additional pressure on global logistics infrastructure. With September’s steeper decline in imports from China (down 12.3% MoM, 22.9% YoY), importers remain highly sensitive to tariff policy. The U.S.–China tariff truce remains in place through November 10, 2025, capping duties at 30%, giving importers temporary stability but leaving forward risk tied to the truce’s outcome. Meanwhile, the reciprocal tariff framework enacted August 7 continues to apply country-specific duties of ~10%–41% across more than 60 trade partners. Legal challenges facing the reciprocal tariffs, however, are advancing. Additionally, new Section 301 vessel fees effective October 14 could increase shipping costs and add clearance complexity for imports arriving on Chinese-built or Chinese-operated vessels.
- Monthly TEU volumes between 2.4M and 2.6M. This level has historically been a key pressure point for U.S. ports and inland logistics networks. After August’s 2.52M TEUs, September volumes declined to 2.31M TEUs, dipping just below the typical pressure range. Heading into the last quarter of the year, the contraction underscores softening seasonal demand as well as the ongoing impact of tariff volatility.
- Port transit wait times. If they decrease, it’s an indication of improved global supply chain efficiencies or that the demand for goods and logistics services is declining. In September 2025, port transit delays showed mixed results with overall minor improvement, as several major gateways reported shorter wait times while a few saw small increases. Overall, U.S. ports continued to manage throughput effectively with no evidence of broad congestion.
- The economy. The U.S. is an import-driven economy, so economic health is an important indicator of container import volumes. In August 2025, nonfarm payrolls rose just 22,000, while July’s gain was revised up to 79,000. The unemployment rate edged up to 4.3% from 4.2%. Real average hourly earnings slipped 0.1% as nominal wages rose 0.3%. A preliminary benchmark revision for March cut total nonfarm employment by 911,000 jobs (0.6%), one of the largest downward adjustments in years. In September, with the federal shutdown delaying the U.S. Bureau of Labor Statistics (BLS) jobs report, markets relied on alternative data: Automatic Data Processing Inc. (ADP) reported a loss of 32,000 private jobs, and a Chicago Fed estimate held unemployment steady at 4.3%. The Fed’s September rate cut to 4.00%–4.25% underscores a dovish tilt amid softening hiring and rising uncertainty.
- Middle East conflict. Houthi-related threats continue to divert carriers from the Suez Canal, extending transit times and raising shipping costs as vessels reroute around the Cape of Good Hope. Houthi Attacks have persisted in September. While some tanker traffic has cautiously returned to the corridor, container carriers remain broadly diverted via the Cape, extending Asia–Europe and Asia–U.S. East Coast transits by 9–14 days. The absence of de-escalation signals that rerouting will remain the baseline assumption for Q4 planning.
Consider recommendations to help minimize global shipping challenges.
In September 2025, U.S. container import volumes declined from August but remained strong, ranking as the third-highest September on record, with year-to-date totals continuing to outpace the same period in 2024. Port delays showed mixed results with overall minor improvement, as lower volumes supported steady throughput across major gateways. At the same time, persistent volatility—including the ongoing Red Sea crisis, U.S. government shutdown, and softening economic indicators—continues to weigh on global supply chains. Descartes is monitoring these developments through Descartes Datamyne, as well as government and industry sources, to support importers in mitigating risk and adjusting operations in a rapidly evolving trade environment.
Short-term:
- Assess potential impacts of the U.S. government shutdown, including slower regulatory processes that may affect import compliance and clearance times.
- Consider modelling the impacts of expanded U.S. tariffs, including the August 7 implementation of reciprocal duties on over 60 countries and the November 10 expiration of the U.S.–China tariff truce.
- Monitor port volumes and delays to assess the possibility of trade disruptions if volumes persist within the 2.4M and 2.6M levels that have historically stressed U.S. maritime logistics infrastructure.
- Track the Middle East conflict as carriers continue to avoid the Red Sea due to escalating Houthi attacks, and heightened Iran–Israel tensions, with rerouting expected to persist.
- Evaluate the impact of inflation and the Russia/Ukraine, Israel/Hamas, and Iran/Israel conflicts on logistics costs and capacity constraints. Ensure that key trading partners are not on sanctions lists.
Near-term:
- For companies that have cargo moving through the Suez Canal and the Strait of Hormuz, evaluate the impact of extended rerouting caused by Middle East conflicts.
Long-term:
- Evaluate supplier and factory location density to mitigate reliance on over-taxed trade lanes and regions of the globe currently experiencing geopolitical conflict or that have the potential for conflict. Density creates economy of scale but also risk, and subsequent logistics capacity crisis highlights the downside.
Notes:
1. U.S. tariff rates cited in this report were current as of 4:00 p.m. ET on October 7, 2025.
2. U.S. government shutdown status and related operational impacts were current as of 4:00 p.m. ET on October 7, 2025.
3. This report uses the initial compiled release of publicly available U.S. Customs and Border Protection (CBP) Bill of Lading (BOL) data for all U.S. ports, which provides a standard, official source of data for reporting on maritime trade. This data can be subject to modification later by CBP. The modified data can be seen in Descartes Datamyne™ where U.S. maritime records are processed daily. Descartes Datamyne is ISO 9001 certified.
4. In Descartes Datamyne™, twenty-foot equivalent units (TEU) are calculated using a combination of container size and weight as declared on Bills of Lading filed with U.S. Customs and Border Protection (CBP).
Subscribe to the Global Shipping Report
Stay informed with the latest shipping trends and U.S. container import logistics data every month with the Descartes Global Shipping Report
About Descartes Datamyne
Leverage the Power of Global Import and Export Trade Data
Optimize trade lanes, expand into new markets, discover alternative buyers and suppliers, as well as spot supply and demand shifts from a single integrated web-based platform to cost-effectively enhance your supply chain resilience and competitive edge.
Special Reports
2024 Top 30 U.S. Port Report
Stay informed with the annual U.S. Port Report from Descartes, ranking 2024 Maritime Port performance and trends in a year that defied expectations.
Download the 2024 Top 30 U.S. Port Report

What Companies are Doing to Tackle Escalating Global Supply Chain Challenges
Offering must-read insights for global trade, this white paper provides an overview of the key challenges facing global supply chain leaders as discovered through Descartes’ 2024 Global Trade Intelligence Survey.
Download the White Paper
How Descartes Can Help
Descartes Datamyne delivers business intelligence with comprehensive, accurate, up-to-date, import and export information.
Our multinational trade data assets can be used to trace global supply chains and our bill-of-lading trade data – with cross-references to company profiles and customs information – can help businesses identify and qualify new sources. Ask us for a free, no obligation demonstration of our data on a product or trade commodity of your choosing – and keep the custom research we create with our compliments.