The Global Shipping Report
August 2025 U.S. Container Imports Remain Strong Amid Pullback in China Volumes and Trade Policy Turmoil
Stay informed with the latest insights from the Descartes Global Shipping Report
Data for the Global Shipping Report provided by Descartes Datamyne
In August 2025, U.S. container imports reached 2,519,722 twenty-foot equivalent units (TEUs)—the second-highest monthly total this year. Volumes were 3.9% below July but 1.6% above August 2024. Despite elevated throughput, port transit delays moved only modestly, indicating that U.S. infrastructure continues to handle heavy volumes more efficiently than in past periods of comparable demand. China-origin imports eased to 869,523 TEUs, down 5.8% from July and 10.8% below August 2024. The pullback follows July’s rebound, which was supported by seasonal demand and suspected frontloading ahead of U.S. tariff deadlines.
Globally, Red Sea risks remain elevated and major carriers continue to reroute around the Cape of Good Hope, adding roughly one to two weeks sailing time to Suez-routed schedules. While the Liberation Day tariffs remain active, key tariff actions are under legal challenge, with an appeals court ruling prompting a petition to the U.S. Supreme Court, though measures remain enforceable pending review. Together, these dynamics keep uncertainty high for global supply chains even as U.S. ports operate in peak demand ranges for a second consecutive month.
In this Article...
- toc
U.S. container imports remain elevated for a second consecutive month, easing slightly from July’s peak.
In August 2025, U.S. container import volumes totaled 2,519,722 TEUs, up 1.6% from August 2024 and 17.6% above pre-Covid August 2019. It’s the second consecutive month of elevated volumes, the second-highest monthly total this year, and only narrowly below the record level 2,622,465 TEUs set in May 2022 (see Figure 1). On a year-to-date basis, volumes through August are tracking 3.3% ahead of the same period in 2024, reinforcing the longer-term trend of resilient demand despite policy uncertainty.
Figure 1: U.S. Container Import Volume Year-over-Year Comparison
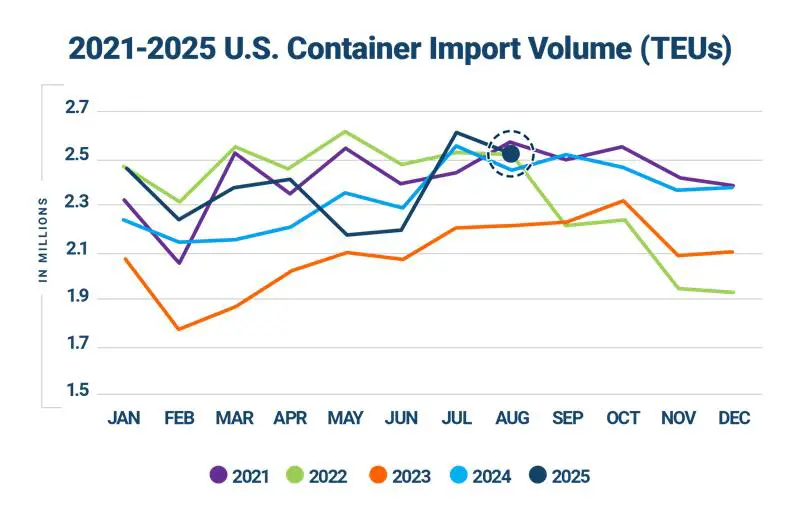
Source: Descartes Datamyne™
August 2025 import volumes were down 3.9% (102,188 TEUs) from July (see Figure 2), a slightly stronger decline than the 3.0% month-over-month drop recorded in August 2024. While consistent with seasonal levels that August has shown in four of the past five years, the elevated volume also underscores the probable sensitivity to tariff timing. Importers continue to adjust shipment flows in response to policy deadlines, including the mid-November expiration of the U.S.–China tariff truce and the August 29 repeal of the U.S. de minimis exemption for all countries, which removed duty-free treatment for low-value parcels.
Figure 2: July to August U.S. Container Import Volume Comparison

Source: Descartes Datamyne™
Top 10 U.S. ports see mixed results in August.
In August 2025, container volumes at the top 10 U.S. ports declined by 4.1% month-over-month, with a combined loss of 92,194 TEUs (see Figure 3). Performance was uneven across gateways, as several major West Coast ports posted sharp month-over-month declines, including Los Angeles (9.3%), Oakland (9.8%), and Tacoma (11.9%). Other ports recorded notable gains, such as Seattle (14.2%), Savannah (6.5%), and Norfolk (6.2%). New York/New Jersey and Houston contributed to the overall pullback, contracting by 6.1% and 10.4% respectively, while Charleston held nearly flat, easing by 0.6%. The mixed results reflect both seasonal adjustments and possible shifts in trade patterns, with importers continuing to balance flows across coasts in response to tariff uncertainty.
Figure 3: July 2025 to August 2025 Comparison of Import Volumes at Top 10 U.S. Ports

Source: Descartes Datamyne™
China-origin imports ease in August amid extended tariff truce.
U.S. containerized imports from China decreased to 869,523 TEUs in August 2025, down 5.8% month-over-month and 10.8% year-over-year, and down 15% compared to the record July 2024 level of 1,022,913 TEUs (see Figure 4). China’s share of total U.S. imports slipped modestly in August to 34.5% from July’s 35.2%.
A large number of China’s top import categories experienced double-digit year-over-year declines. Aluminum and products thereof (HS-76) saw the steepest drop, down 43.9%. Apparel (HS-61, HS-62) and footwear (HS-64) were also down—by more than 20% from August 2024. Additionally, furniture and bedding (HS-94) was down 14.3%, toys and sporting goods (HS-95) down 17.4%, electric machinery (HS-85) down 14.1%, vehicles (HS-87) down 13.4%, articles of iron or steel (HS-73) down 18.2%. In contrast, plastics (HS-39) grew nearly 10% and expanded its share to over 13% of all China-origin TEUs.
August volumes come against the backdrop of a 90-day extension of the U.S.–China tariff truce, which preserves the 30% tariff ceiling through mid-November. Despite ongoing adjustments across sectors, trade volumes continue to highlight China’s central role in U.S. supply chains. However, with the November deadline looming amid ongoing negotiations, the outlook for China’s share of U.S. imports remains sensitive.
Figure 4: August 2024–August 2025 Comparison of U.S. Total and Chinese TEU Container Volume Relative to Chinese Import Record

Source: Descartes Datamyne
China-origin imports fall on West Coast, while East Coast ports post modest growth.
In August 2025, China-origin imports across the top 10 U.S. ports fell by 53,340 TEUs, a 6.1% month-over-month decline (see Figure 5). West Coast gateways led the pullback, with Los Angeles (10.2%), Long Beach (7.1%), Oakland (10.1%), and Tacoma (15.6%) all posting substantial declines. Gulf Coast volumes also contracted, with Houston down sharply by 21.0%. In contrast, several ports registered growth—Norfolk (16.9%) and Charleston (6.0%) on the East Coast, and Seattle (17.7%) on the West Coast—while New York/Newark inched up 3.3% and Savannah held nearly flat. The uneven performance may reflect a rebalancing from July’s sharp rebound, with indications that possible frontloading activity could be easing.
Figure 5: July 2025 to August 2025 Comparison of top U.S. Ports for Imports Originating from China

Source: Descartes Datamyne
U.S. imports from top 10 CoOs ease in August as China pullback drives overall decline.
In August 2025, U.S. containerized imports from the top 10 CoOs fell 4.4% month-over-month—a combined decline of 83,296 TEUs (see Figure 6). The decrease was led by China, down 53,552 TEUs (5.8%), with notable declines from South Korea (11.8%), Japan (14.5%), and Taiwan (12.9%). Smaller drops from Vietnam (0.5%), Hong Kong (1.4%), Thailand (0.6%), and Germany (1.3%) added to the softening of volumes. Offsetting gains were limited to Indonesia (5.3%) and India (1.7%). Overall, momentum cooled in August following July’s broad surge.
Figure 6: July 2025 to August 2025 Comparison of U.S. Import Volumes from Top 10 Countries of Origin

Source: Descartes Datamyne
Modest year-over-year CoO growth driven by Vietnam, India, and Thailand.
In August 2025, U.S. containerized imports from the top 10 CoOs rose by a slight 0.7% year-over-year—a net gain of 11,818 TEUs (see Figure 7). The increase was driven by strong growth from Vietnam (25.2%), India (34.0%), Thailand (35.6%), and Indonesia (45.6%), with additional gains from Japan (4.3%) and Hong Kong (2.1%). These advances more than offset declines from China (10.8%), South Korea (11.0%), Germany (9.8%), and Taiwan (9.4%). The pattern underscores ongoing diversification toward South and Southeast Asia even as China remains the largest, but most volatile, source of U.S. imports.
Figure 7: August 2024 to August 2025 Comparison of U.S. Import Volumes from Top 10 Countries of Origin

Source: Descartes Datamyne™
East and Gulf ports up, West Coast ports down.
In August 2025, port shares changed only slightly from July (see Figure 8). East and Gulf Coast ports increased their market share to 40.8% (up 1.5%), and West Coast ports eased to 44.1% (down 1.7%). In August, the top 10 ports handled 84.9% of total volumes, down a marginal 0.2% from July. These small moves keep both coasts within this year’s typical volume ranges, signaling a stable coast-to-coast mix.
Figure 8: Volume Analysis for Top Ports, West Coast Ports and East and Gulf Coast Ports

Source: Descartes Datamyne™
Port delays extend modestly in August despite a second month of elevated volumes.
Despite elevated August volumes, port transit time delays increased only modestly over July, indicating that top East and West Coast ports are absorbing the added pressure without major disruption (see Figure 9). In the East, Norfolk (1.1 days) and Charleston (0.2 days) experienced small increases in delays. On the West Coast, Long Beach (1.0 days), Seattle (0.3 days), and Tacoma (0.2 days) also experienced small increases. Los Angeles and New York/New Jersey showed modest decreases in delays, improving to 3.0 days and 6.0 days, respectively; Savannah eased to 4.8 days, and Houston improved to 3.7 days. Oakland held steady at 4.9 days, unchanged from July.
Figure 9: Monthly Average Transit Delays (in days) for the Top 10 Ports (Jun. 2025 – Aug. 2025)

Source: Descartes Datamyne™
Note: Descartes’ definition of port transit delay is the difference as measured in days between the Estimated Arrival Date, which is initially declared on the bill of lading, and the date when Descartes receives the CBP-processed bill of lading data.
Trusted by
Stay informed with monthly shipping insights with the Global Shipping Report

Director, Industry Strategy, Global Trade Intelligence, Descartes

Gulf Coast imports decline in August.
In August 2025, Gulf Coast container imports decreased to 227,401 TEUs, down 8.3% from July’s 247,982 TEUs (see Figure 10). While the decline reverses July’s rebound, volumes are still above June and in line with the rolling 12-month average of 230,318 TEUs, indicating normalization rather than a shift in underlying demand. Transit delays across Gulf Coast ports, however, increased ~15% in August—pointing to localized pressure even as throughput fell compared to July and held close to the annual average.
Figure 10: September 2024 to August 2025 U.S. Gulf Coast Container Imports

Source: Descartes Datamyne™
U.S.–China truce holds with tariffs capped at 30% as disputes persist.
The U.S.–China tariff truce remains in force, pausing escalations and keeping U.S. duties on Chinese goods capped at 30% through November 10, 2025. While a baseline reciprocal tariff regime continues, talks have delivered narrow relief. Core friction points—IP enforcement, tech transfer, and state-backed industrial support—remain unresolved, leaving the trade environment fragile and contingent on further negotiations ahead of the November deadline.
Liberation Day tariffs remain in force while facing legal headwinds.
As of September 2025, the Liberation Day tariff framework remains in effect but under significant legal challenge. On August 29, 2025, the Federal Circuit Court of Appeals ruled that both the April 2025 Liberation Day tariffs and the February 2025 bilateral tariffs on Canada, China, and Mexico exceeded presidential authority under the International Emergency Economic Powers Act. The decision is stayed through October 14, 2025, allowing the administration time to petition the U.S. Supreme Court. For now, all tariffs remain enforceable during review, sustaining importer strategies such as suspected frontloading and supply chain diversification amid persistent policy uncertainty.
The tariff structure itself continues to expand. The baseline 10% universal tariff took effect on April 5, 2025. At the same time, a set of country-specific reciprocal tariffs was announced, originally scheduled for April 9 but postponed during a negotiation period. These reciprocal tariffs—generally ranging from ~10% to 41%—ultimately took effect on August 7, 2025, covering many of the United States’ largest trading partners.
Red Sea risks remain elevated as Houthi threats intensify and rerouting persists.
Red Sea disruptions persist into early September, with new incidents reported near Hodeidah/Bab el-Mandeb as Houthi threats continue. Major carriers are still avoiding Suez and running Cape of Good Hope networks. Detours typically add about 9–14 days to Asia–Europe (and Suez-routed Asia–U.S. East Coast) transits. With no clear de-escalation, traffic through the Red Sea/Suez system remains well below pre-crisis norms and carriers continue planning around the Cape for the foreseeable future.
Managing supply chain risk: what to watch in 2025.
In August 2025, U.S. container imports eased modestly from July but remained elevated in the 2.4M–2.6M TEU band, underscoring continued strong performance even as China-origin volumes declined. China’s pullback reflects a cooling after July’s rebound, but overall demand remained resilient in the face of ongoing tariff uncertainty and geopolitical risks. While the U.S.–China tariff truce continues to cap duties at 30% through mid-November 2025, reciprocal tariffs expanded to more than 60 countries on August 7, and key tariff measures are now under legal challenge headed to the Supreme Court, leaving importers to weigh risks and plan mitigation efforts. Meanwhile, Red Sea security remains fragile, with carriers maintaining Cape of Good Hope routings that extend sailing times. Here’s what Descartes is monitoring in the months ahead:
- Expanded tariffs and other potential ‘protectionist’ trade policies. Broader and deeper tariffs applied to a wide array of goods could compel U.S. importers to significantly re-engineer their supply chains, putting additional pressure on global logistics infrastructure. While the U.S.–China tariff truce has been extended through November 10, 2025, China imports dipped in August as suspected frontloading tapered. The U.S. reciprocal tariff program, originally announced with the April 2025 Liberation Day tariffs, ultimately took effect on August 7, setting country-specific rates generally between 10% and ~41% across more than 60 countries. These and other tariff measures are now under active legal challenge following an August 29 federal appeals court ruling that found the actions exceeded presidential authority, though they remain enforceable pending Supreme Court review, keeping supply chain strategies in flux.
- Monthly TEU volumes between 2.4M and 2.6M. This level has historically been a key pressure point for U.S. ports and inland logistics networks. After July’s surge to 2.62M TEUs (just below the May 2022 record), August 2025 posted a second month of elevated volumes at 2.52M TEUs. While these monthly volumes land well within the peak demand range, policy uncertainty persists, making near-term volumes difficult to forecast.
- Port transit wait times. If they decrease, it’s an indication of improved global supply chain efficiencies or that the demand for goods and logistics services is declining. In August 2025, port transit delays increased only modestly from July even as import volumes remained elevated. Movements were mixed across coasts, suggesting that ports are continuing to absorb throughput without widespread congestion.
- The economy. The U.S. is an import-driven economy, so economic health is an important indicator of container import volumes. In July 2025, the U.S. labor market showed further cooling: nonfarm payrolls rose 73,000 and the unemployment rate held at 4.2%, while prior-month revisions cut May and June by a combined 258,000 jobs, revealing softer momentum than initially reported. At its July 30 meeting, the Fed kept the funds rate at 4.25%–4.50%, and markets now price a high likelihood of a September rate cut amid officials’ concern about weakening labor conditions. Meanwhile, the U.S.–China tariff truce runs through November 10, 2025 and the administration’s broader reciprocal tariff actions remain under legal challenge even as they stay in effect pending appeal—factors that continue to cloud business planning heading into late 2025.
- Middle East conflict. Houthi-related threats continue to divert carriers from the Suez Canal, extending transit times and raising shipping costs as vessels reroute around the Cape of Good Hope. Attacks and attempted strikes have persisted into early September, including a suspected missile incident off Hodeidah and associated electronic interference reported, underscoring sustained risk in the southern Red Sea/Bab el-Mandeb. Naval protection missions remain in place yet carriers broadly remain diverted.
Consider recommendations to help minimize global shipping challenges.
In August 2025, U.S. container import volumes showed continued strong performance. Port conditions remained stable, with modest, mixed changes in transit delays rather than broad congestion. However, persistent volatility—including the Red Sea crisis, stricter enforcement on China-linked transshipments, and uncertain economic signals—continues to challenge global supply chains. Descartes is closely tracking these developments through Descartes Datamyne, alongside government and industry sources, to help importers mitigate risk and adapt their operations in a rapidly shifting trade landscape.
Short-term:
- Consider modelling the impacts of expanded U.S. tariffs, including the August 7 implementation of reciprocal duties on over 60 countries and the November 10 expiration of the U.S.–China tariff truce.
- Monitor port volumes and delays to assess the possibility of trade disruptions if volumes persist within the 2.4M and 2.6M levels that have historically stressed U.S. maritime logistics infrastructure.
- Track the Middle East conflict as carriers continue to avoid the Red Sea due to escalating Houthi attacks, and heightened Iran–Israel tensions, with rerouting expected to persist.
- Evaluate the impact of inflation and the Russia/Ukraine, Israel/Hamas, and Iran/Israel conflicts on logistics costs and capacity constraints. Ensure that key trading partners are not on sanctions lists.
Near-term:
- For companies that have cargo moving through the Suez Canal and the Strait of Hormuz, evaluate the impact of extended rerouting caused by Middle East conflicts.
Long-term:
- Evaluate supplier and factory location density to mitigate reliance on over-taxed trade lanes and regions of the globe currently experiencing geopolitical conflict or that have the potential for conflict. Density creates economy of scale but also risk, and subsequent logistics capacity crisis highlights the downside.
Notes:
- U.S. tariff rates cited in this report were current as of 4pm ET on September 5, 2025.
- This report uses the initial compiled release of publicly available U.S. Customs and Border Protection (CBP) Bill of Lading (BOL) data for all U.S. ports, which provides a standard, official source of data for reporting on maritime trade. This data can be subject to modification later by CBP. The modified data can be seen in Descartes Datamyne™ where U.S. maritime records are processed daily. Descartes Datamyne is ISO 9001 certified.
- In Descartes Datamyne™, twenty-foot equivalent units (TEU) are calculated using a combination of container size and weight as declared on Bills of Lading filed with U.S. Customs and Border Protection (CBP).
Subscribe to the Global Shipping Report
Stay informed with the latest shipping trends and U.S. container import logistics data every month with the Descartes Global Shipping Report
About Descartes Datamyne
Leverage the Power of Global Import and Export Trade Data
Optimize trade lanes, expand into new markets, discover alternative buyers and suppliers, as well as spot supply and demand shifts from a single integrated web-based platform to cost-effectively enhance your supply chain resilience and competitive edge.
Special Reports
2024 Top 30 U.S. Port Report
Stay informed with the annual U.S. Port Report from Descartes, ranking 2024 Maritime Port performance and trends in a year that defied expectations.
Download the 2024 Top 30 U.S. Port Report

What Companies are Doing to Tackle Escalating Global Supply Chain Challenges
Offering must-read insights for global trade, this white paper provides an overview of the key challenges facing global supply chain leaders as discovered through Descartes’ 2024 Global Trade Intelligence Survey.
Download the White Paper
How Descartes Can Help
Descartes Datamyne delivers business intelligence with comprehensive, accurate, up-to-date, import and export information.
Our multinational trade data assets can be used to trace global supply chains and our bill-of-lading trade data – with cross-references to company profiles and customs information – can help businesses identify and qualify new sources. Ask us for a free, no obligation demonstration of our data on a product or trade commodity of your choosing – and keep the custom research we create with our compliments.