The Global Shipping Report
April U.S. Container Imports Ease as Trade Uncertainty and Geopolitical Risks Persist
Stay informed with the latest insights from the Descartes Global Shipping Report
Data for the Global Shipping Report provided by Descartes Datamyne
In April 2026, U.S. containerized imports totaled 2,277,965 twenty-foot equivalent units (TEU), declining 3.2% from March and 5.5% year-over-year. Despite the pullback, volumes remained 18.7% above April 2019 levels, reflecting continued resilience in underlying demand even as broader trade conditions soften.
China-origin imports declined further to 680,778 TEUs, down 4.3% month-over-month and more than 33% below their July 2024 peak, continuing to weigh on overall import performance. While sourcing diversification toward Southeast Asia and other regions persists, imports from the top 10 countries of origin (CoO) declined 3.1% month-over-month in April after increasing 8.2% in March, signaling a reversal in near-term sourcing momentum. On a year-over-year basis, top 10 CoO volumes fell 6.3%, pointing to broader moderation in global sourcing activity.
At the same time, the global trade environment is becoming increasingly complex. Ongoing tensions in the Middle East continue to disrupt key maritime corridors, with elevated risks around the Strait of Hormuz and continued instability in the Red Sea and Bab al-Mandeb driving rerouting, longer transit times, and higher costs. Meanwhile, U.S. trade policy remains in flux, with Section 122 tariffs in place, tariff refunds now targeted to begin on May 12, and uncertainty surrounding future policy extensions. Trade relations with key partners, including the EU, India, and China, remain unresolved, reinforcing a global shipping environment defined by volatility, shifting sourcing strategies, and heightened cost uncertainty.
In this Article...
- U.S. container imports reached 2,277,965 TEUs in April 2026.
- April 2026 imports decreased by 3.2% over March and were 5.5% lower than April 2025.
- April 2026 imports from China were 680,778 TEUs, down 4.3% from March and 33.4% below the record high of 1,022,913 TEUs set in July 2024.
- April 2026 U.S. imports from the top 10 CoO decreased by 3.1% over March.
- In April 2026, West Coast ports regained market share leadership from East and Gulf Coast ports after briefly trailing in March.
- April 2026 port transit delays improved across most U.S. gateways, particularly on the West Coast and Pacific Northwest, with isolated congestion at Long Beach and minor increases at select East Coast ports.
- Middle East tensions remain elevated, with ongoing security risks around the Strait of Hormuz and continued instability in the Red Sea and Bab al-Mandeb corridor disrupting global shipping routes.
- EU–U.S. trade tensions have re-escalated, with implementation of the previously approved agreement still pending and growing risk of renewed tariff actions.
- U.S.–India trade talks remain constructive but unresolved, with no clear timeline for agreement, limiting near-term impact on tariff structures and sourcing strategies.
- U.S.–China trade engagement has resumed ahead of a potential summit, but tensions persist and no concrete tariff or policy changes have been announced.
- U.S. tariff policy remains in flux, with Section 122 tariffs in place, refunds of prior duties beginning, and continued uncertainty around extensions and future trade measures.
- Key points to monitor and manage supply chain risks.
- Recommendations to help mitigate global shipping challenges.
U.S. container imports ease slightly in April following March rebound.
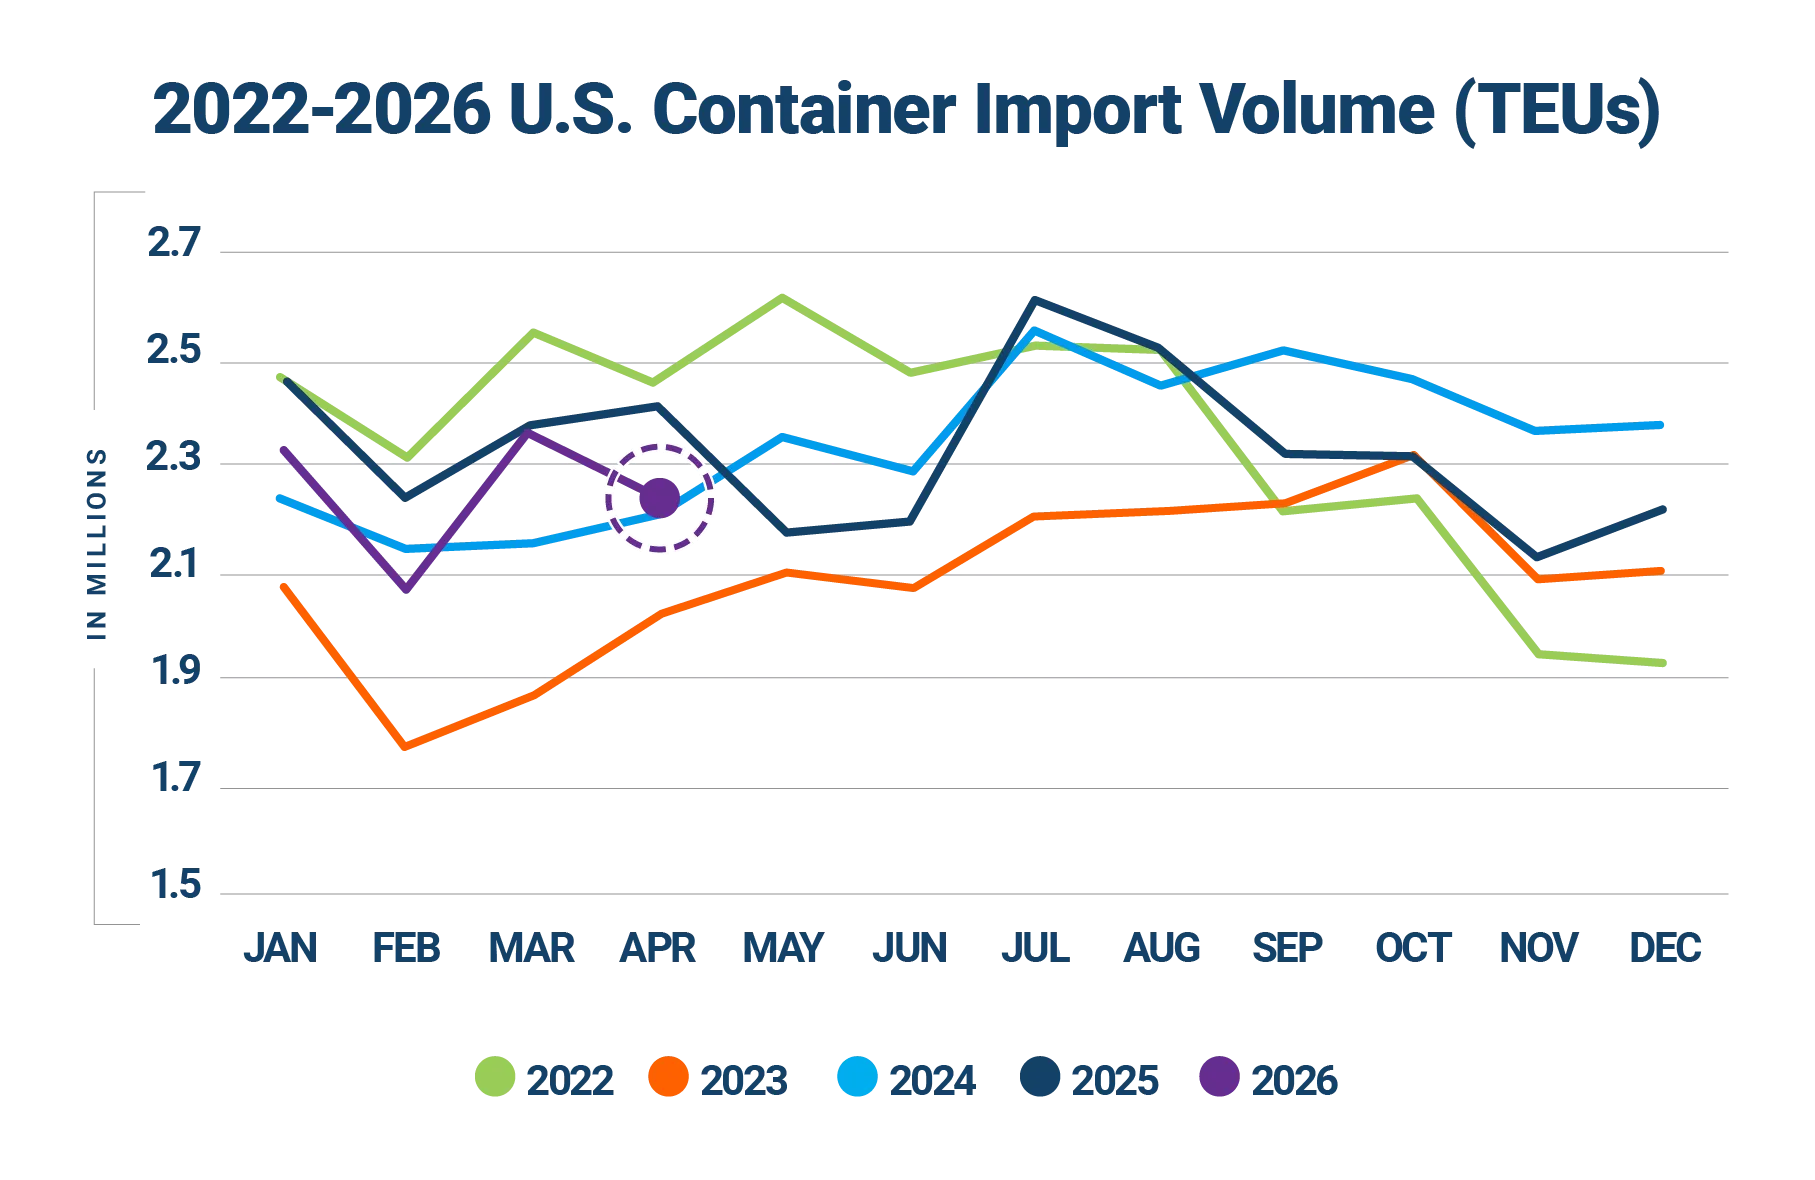
U.S. containerized imports totaled 2,277,965 TEUs in April 2026, down 3.2% month-over-month and 5.5% lower compared to April 2025 (see Figure 1). The April pullback suggests a moderation following March’s rebound, with volumes still reflecting underlying demand despite ongoing policy uncertainty. Imports remained elevated relative to pre-pandemic levels, standing 18.7% above April 2019. Year-to-date imports are trailing 2025 levels by 5.0%.
Figure 1: U.S. Container Import Volume Year-over-Year Comparison
Source: Descartes Datamyne™
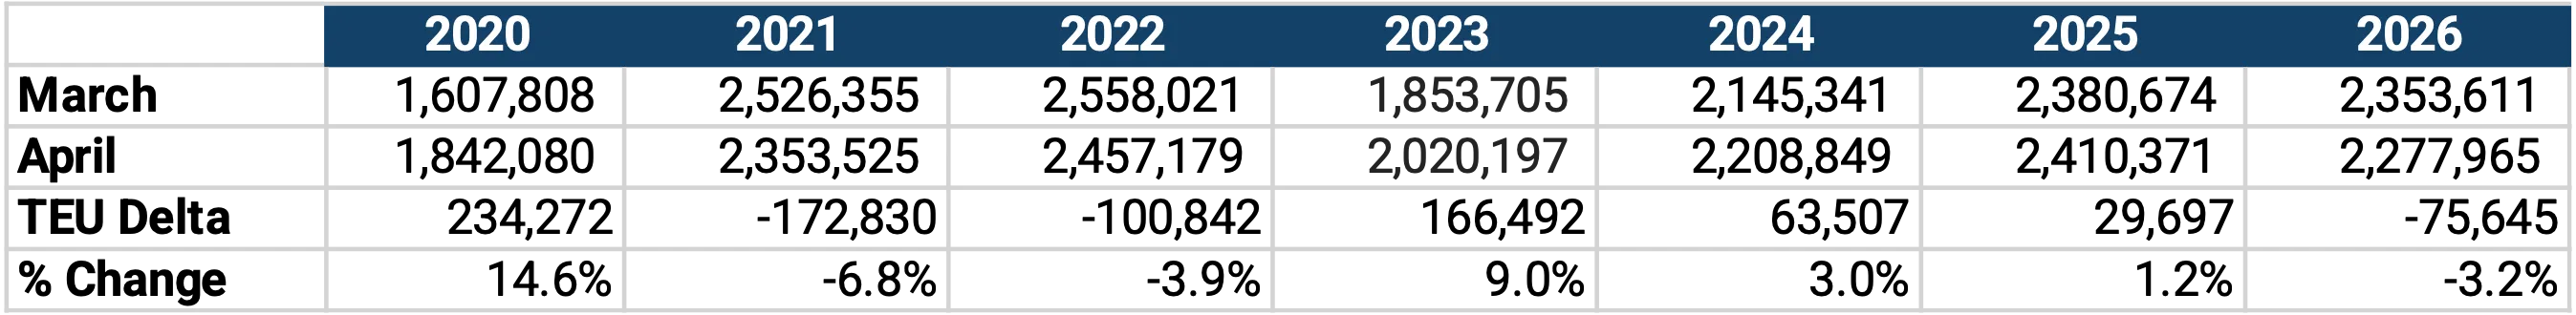
Breaking from the typical seasonal pattern of month-over-month increases observed in 8 of the previous 10 years, April volume fell by 75,645 TEUs (3.2%) from March (see Figure 2). Despite the pullback, April 2026 import volume was only slightly below the post-pandemic average for the month, indicating continued but moderating import activity.
Figure 2: March to April U.S. Container Import Volume Comparison
Source: Descartes Datamyne™
Volumes at top 10 U.S. ports post slight decline in April.
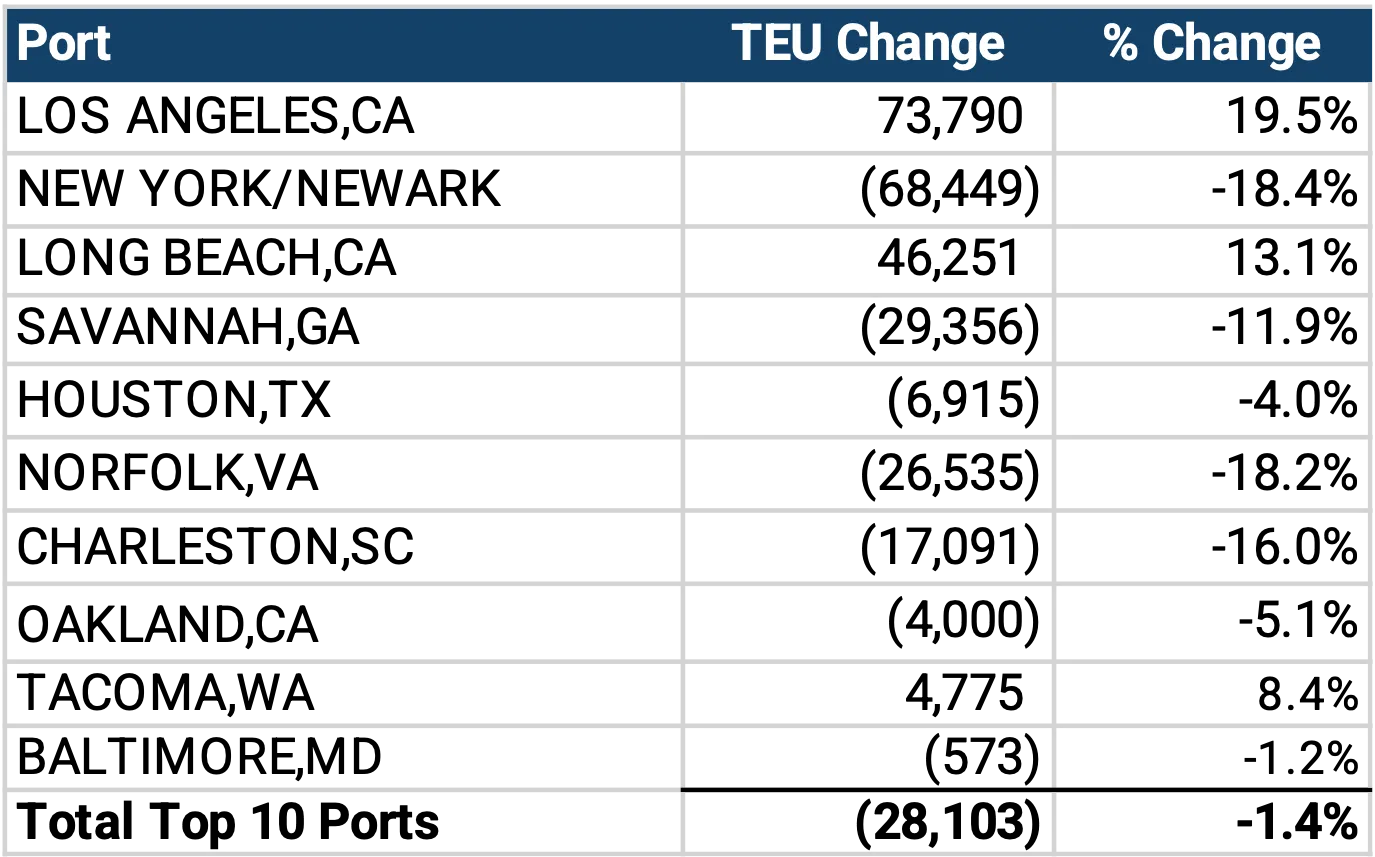
Container volumes across the top 10 U.S. ports decreased by 28,103 TEUs in April 2026, a slight 1.4% month-over-month decline (see Figure 3). Performance across individual ports was mixed, with three of the ten major gateways posting gains. Los Angeles recorded the largest increase, rising 19.5% (73,790 TEUs), followed by Long Beach, up 13.1% (46,251 TEUs), and Tacoma, which increased 8.4% (4,775 TEUs). In contrast, several major East and Gulf Coast ports saw notable declines. New York/Newark posted the largest drop, falling 18.4% (68,449 TEUs), followed by Norfolk, down 18.2% (26,535 TEUs), and Charleston, which declined 16.0% (17,091 TEUs). Additional decreases were recorded at Savannah (11.9%), Oakland (5.1%), Houston (4.0%), and Baltimore (1.2%), indicating a broad-based pullback across East and Gulf Coast ports.
Figure 3: March 2026 to April 2026 Comparison of Import Volumes at Top 10 U.S. Ports
Source: Descartes Datamyne™
China-origin imports weaken further in April with broad-based declines.
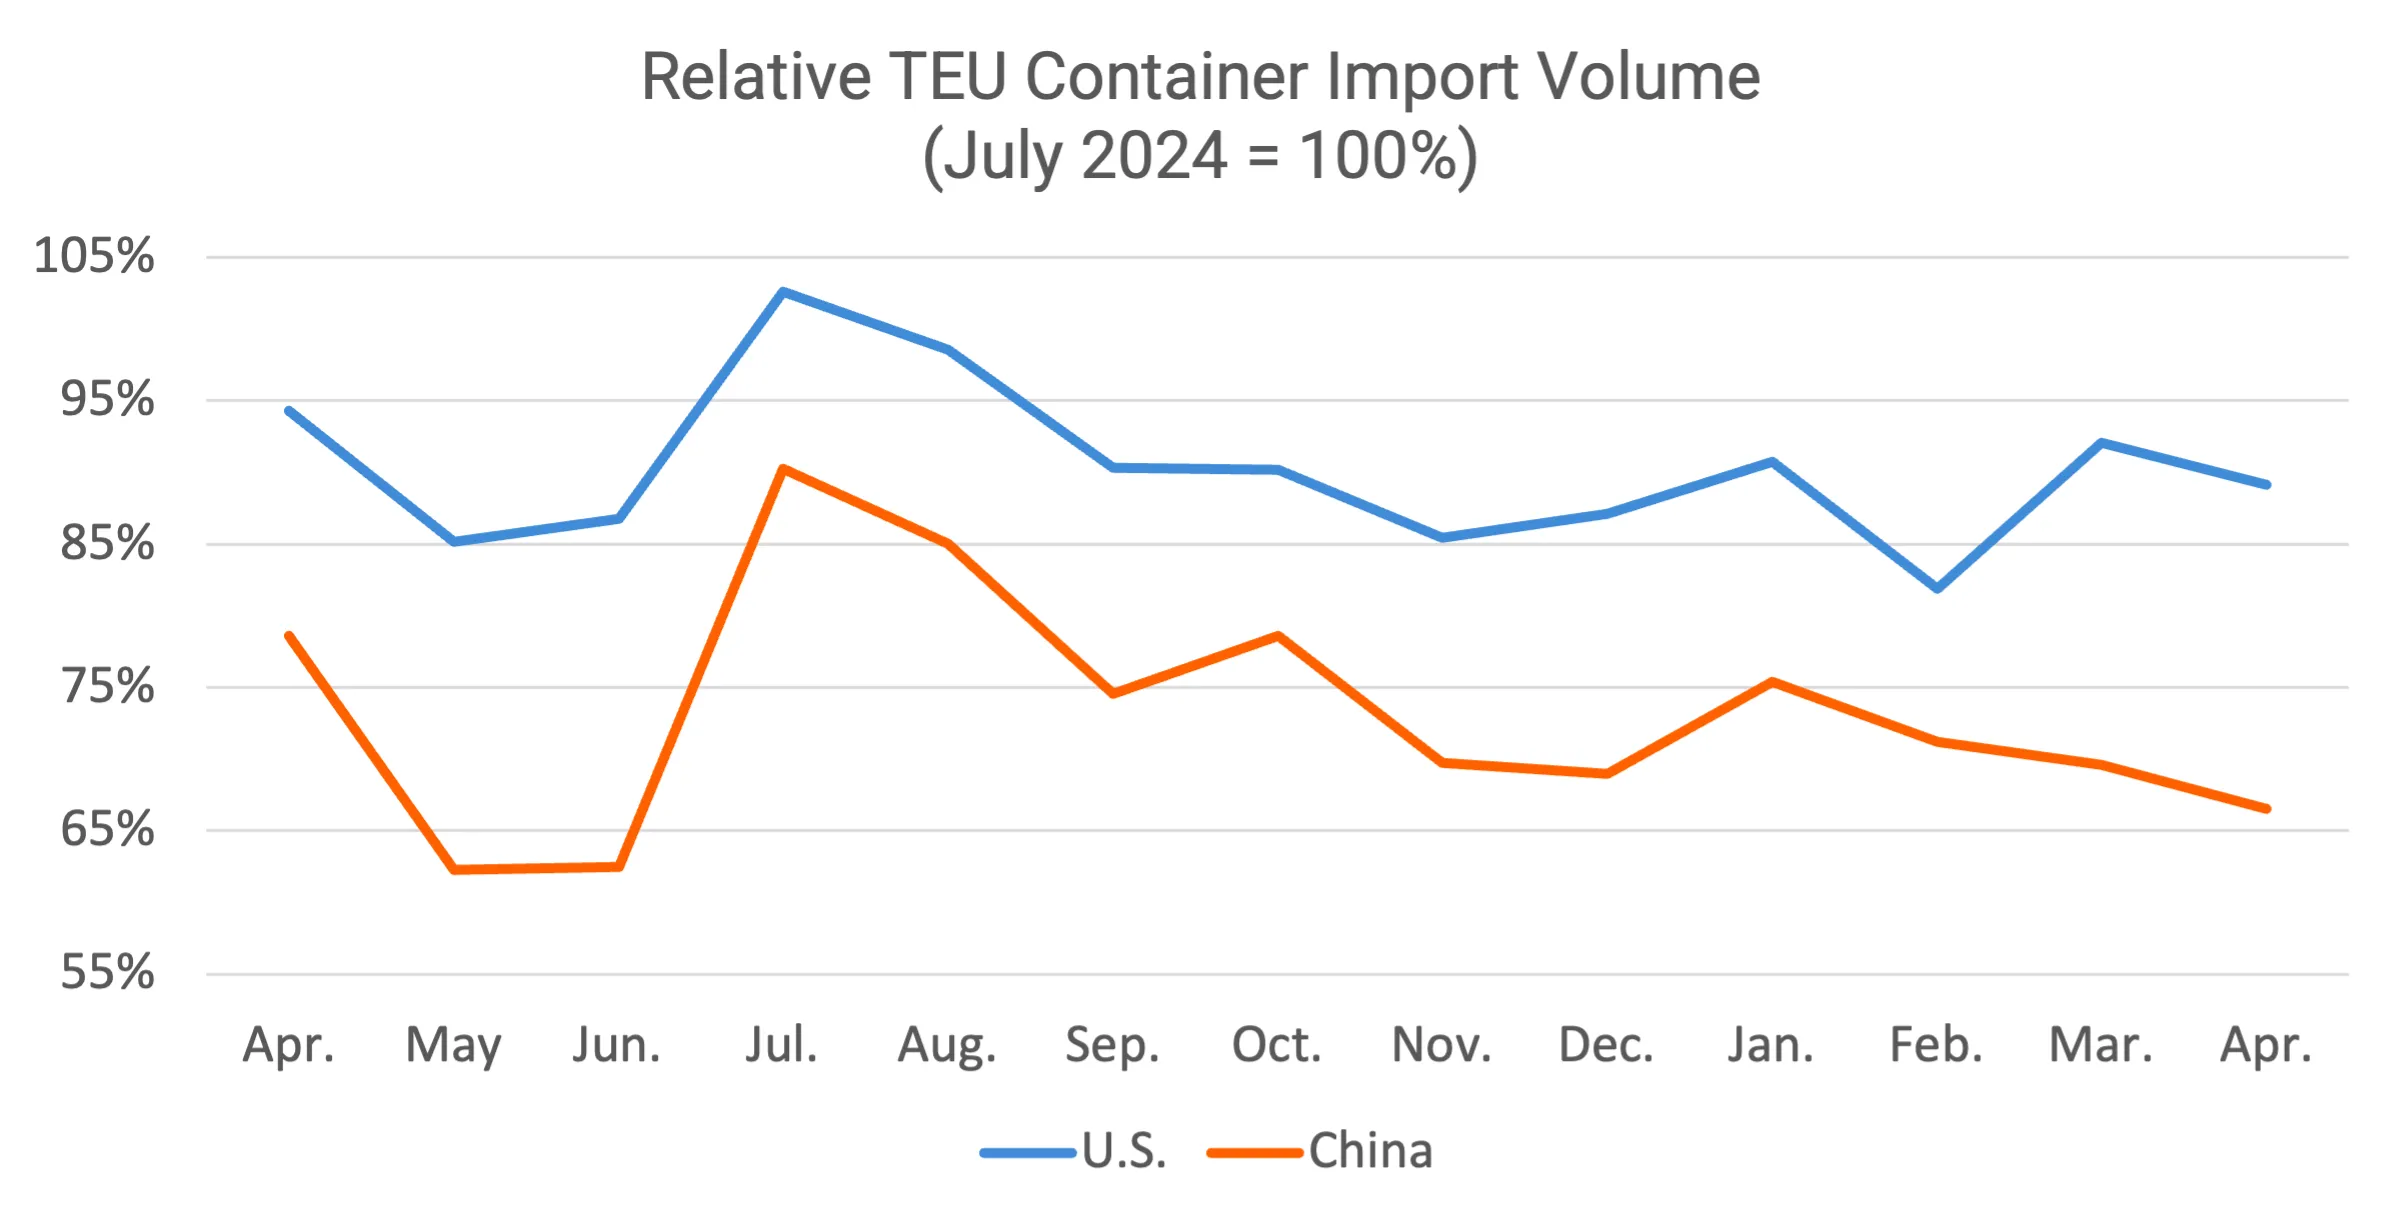
U.S. containerized imports from China totaled 680,778 TEUs in April 2026, down 4.3% month-over-month (see Figure 4), lower by 15.3% year-over-year, and 33.4% below the July 2024 peak of 1,022,913 TEUs. China’s share of total U.S. container imports fell to 29.9%, a 0.3 percentage point decline from March, continuing the downward trend in relative contribution. The April decline reflects ongoing demand softness and shifting sourcing patterns impacting overall volumes.
China’s import mix remained concentrated in consumer goods and key industrial inputs. Plastics (HS-39) ranked as the largest category at 107,732 TEUs, accounting for 15.8% of China-origin imports. Furniture and bedding (HS-94) followed closely at 107,077 TEUs (15.7%). Machinery (HS-84) and electrical machinery (HS-85) together represented 19.4% of total volume (11.8% and 7.6%, respectively). Consumer-oriented categories continued to account for a smaller share of imports. Toys and sporting goods (HS-95) represented 5.8% of volume, while apparel and footwear categories (HS-61, HS-62, HS-63, HS-64) collectively contributed a modest share, each representing less than 4% individually. Overall, imports from China continued to experience broad-based volume weakness across most segments, with limited signs of category-level growth.
Figure 4: April 2025–April 2026 Comparison of U.S. Total and Chinese TEU Container Volume Relative to Chinese Import Record
Source: Descartes Datamyne
China-origin volumes decline across most major U.S. ports in April.
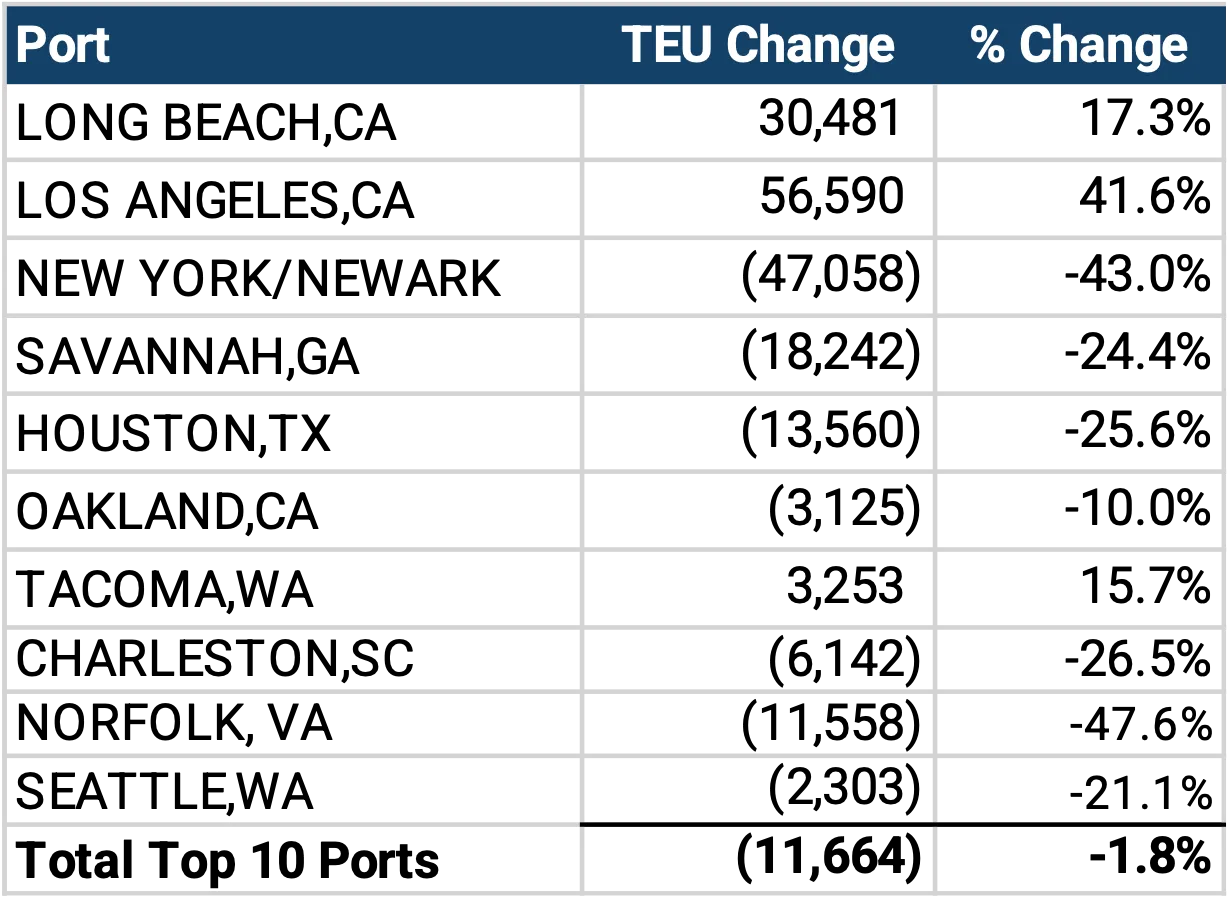
Port-level performance in April showed broad declines, with seven of the top 10 gateways contributing to a slight 1.8% overall decrease (11,664 TEUs) compared to March. New York/Newark recorded the largest drop, falling 43.0%, followed by Norfolk (47.6%), Houston (25.6%), Charleston (26.5%), Savannah (24.4%), Seattle (21.1%), and Oakland (10.0%). In contrast, gains were concentrated at key West Coast ports, with Los Angeles rising 41.6% (56,590 TEUs), Long Beach up 17.3% (30,481 TEUs), and Tacoma increasing 15.7% (3,253 TEUs).
These significant swings likely reflect a rapid rebalancing of import routing rather than a sudden change in underlying demand. In March, China-origin volumes surged into East and Gulf Coast ports, particularly New York/Newark (44.0%) and Norfolk (29.5%), while West Coast ports saw sharp declines. April appears to represent a reversal of that pattern, with volumes shifting back toward traditional West Coast gateways. This type of whipsaw movement is often driven by a combination of factors, including post–Lunar New Year shipment timing, carrier network adjustments, cost and transit-time optimization, and ongoing disruption to global shipping routes.
Figure 5: March 2026 to April 2026 Comparison of top U.S. Ports for Imports Originating from China
Source: Descartes Datamyne
Top 10 CoO volumes decline in April, with mixed performance across key markets.
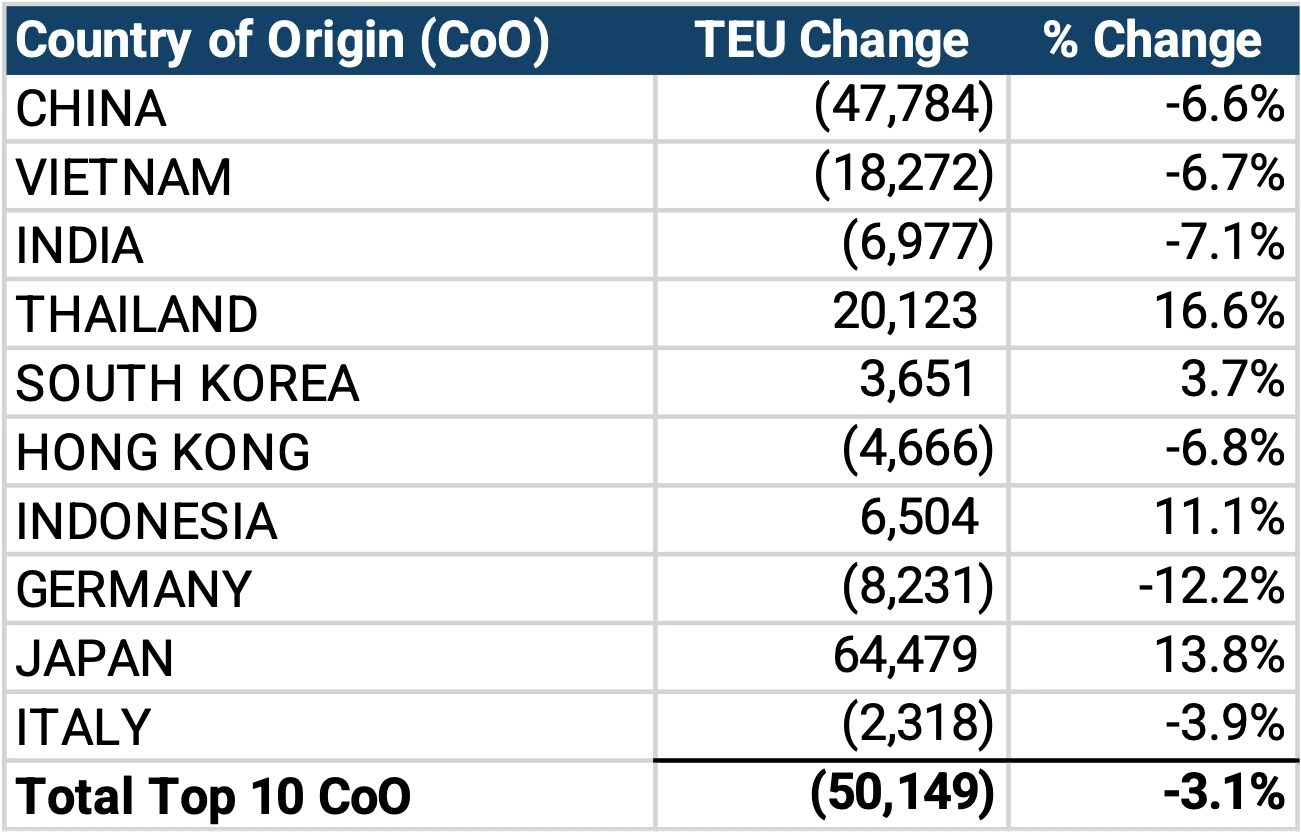
In April 2026, U.S. containerized imports from the top 10 CoO decreased 3.1% month-over-month representing a combined decline of 50,149 TEUs (see Figure 6). Performance across major sourcing countries was mixed, with gains concentrated in a few markets. Japan recorded the largest volume increase, rising 64,479 TEUs (13.8%), followed by Thailand, up 20,123 TEUs (16.6%), and Indonesia, which increased 6,504 TEUs (11.1%). South Korea also posted a modest gain of 3,651 TEUs (3.7%). However, declines were more widespread across other major sourcing countries. China posted the largest drop, down 47,784 TEUs, followed by Vietnam (18,272 TEUs), India (6,977 TEUs), Germany (8,231 TEUs), Hong Kong (4,666 TEUs), and Italy (2,318 TEUs). Overall, April results reflect a broad-based pullback in import volumes across key sourcing markets, with gains in select countries unable to offset declines led by China and other major exporters.
Figure 6: March 2026 to April 2026 Comparison of U.S. Import Volumes from Top 10 Countries of Origin
Source: Descartes Datamyne
Mixed year-over-year performance as Southeast Asia grows but China drives net decline
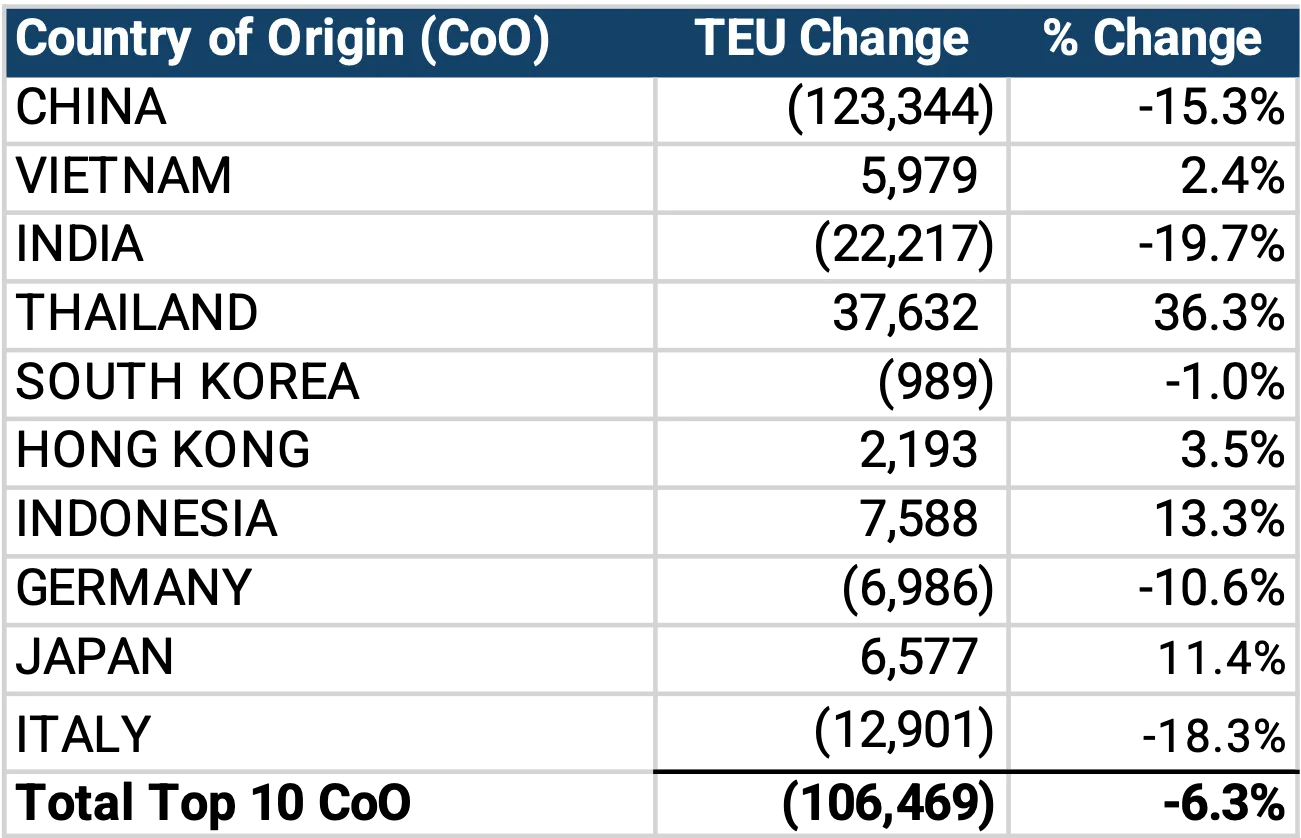
In April 2026, U.S. containerized imports from the top 10 CoO declined 6.3% year-over-year, representing a combined decrease of 106,469 TEUs (see Figure 7). The contraction was driven by significant declines across several major sourcing countries, most notably China, which fell 15.3% (123,344 TEUs), along with India (19.7%), Italy (18.3%), and Germany (10.6%). In contrast, several Asian sourcing markets continued to show resilience. Thailand recorded the strongest growth, surging 36.3% (37,632 TEUs), followed by Indonesia, up 13.3% (7,588 TEUs), and Japan, which increased 11.4% (6,577 TEUs). April results highlight continued divergence in global sourcing patterns. While growth across Southeast and East Asia markets remains notable, it was not sufficient to offset the broader decline.
Figure 7: April 2025 to April 2026 Comparison of U.S. Import Volumes from Top 10 Countries of Origin
Source: Descartes Datamyne™
West Coast ports reclaim market share lead in April.
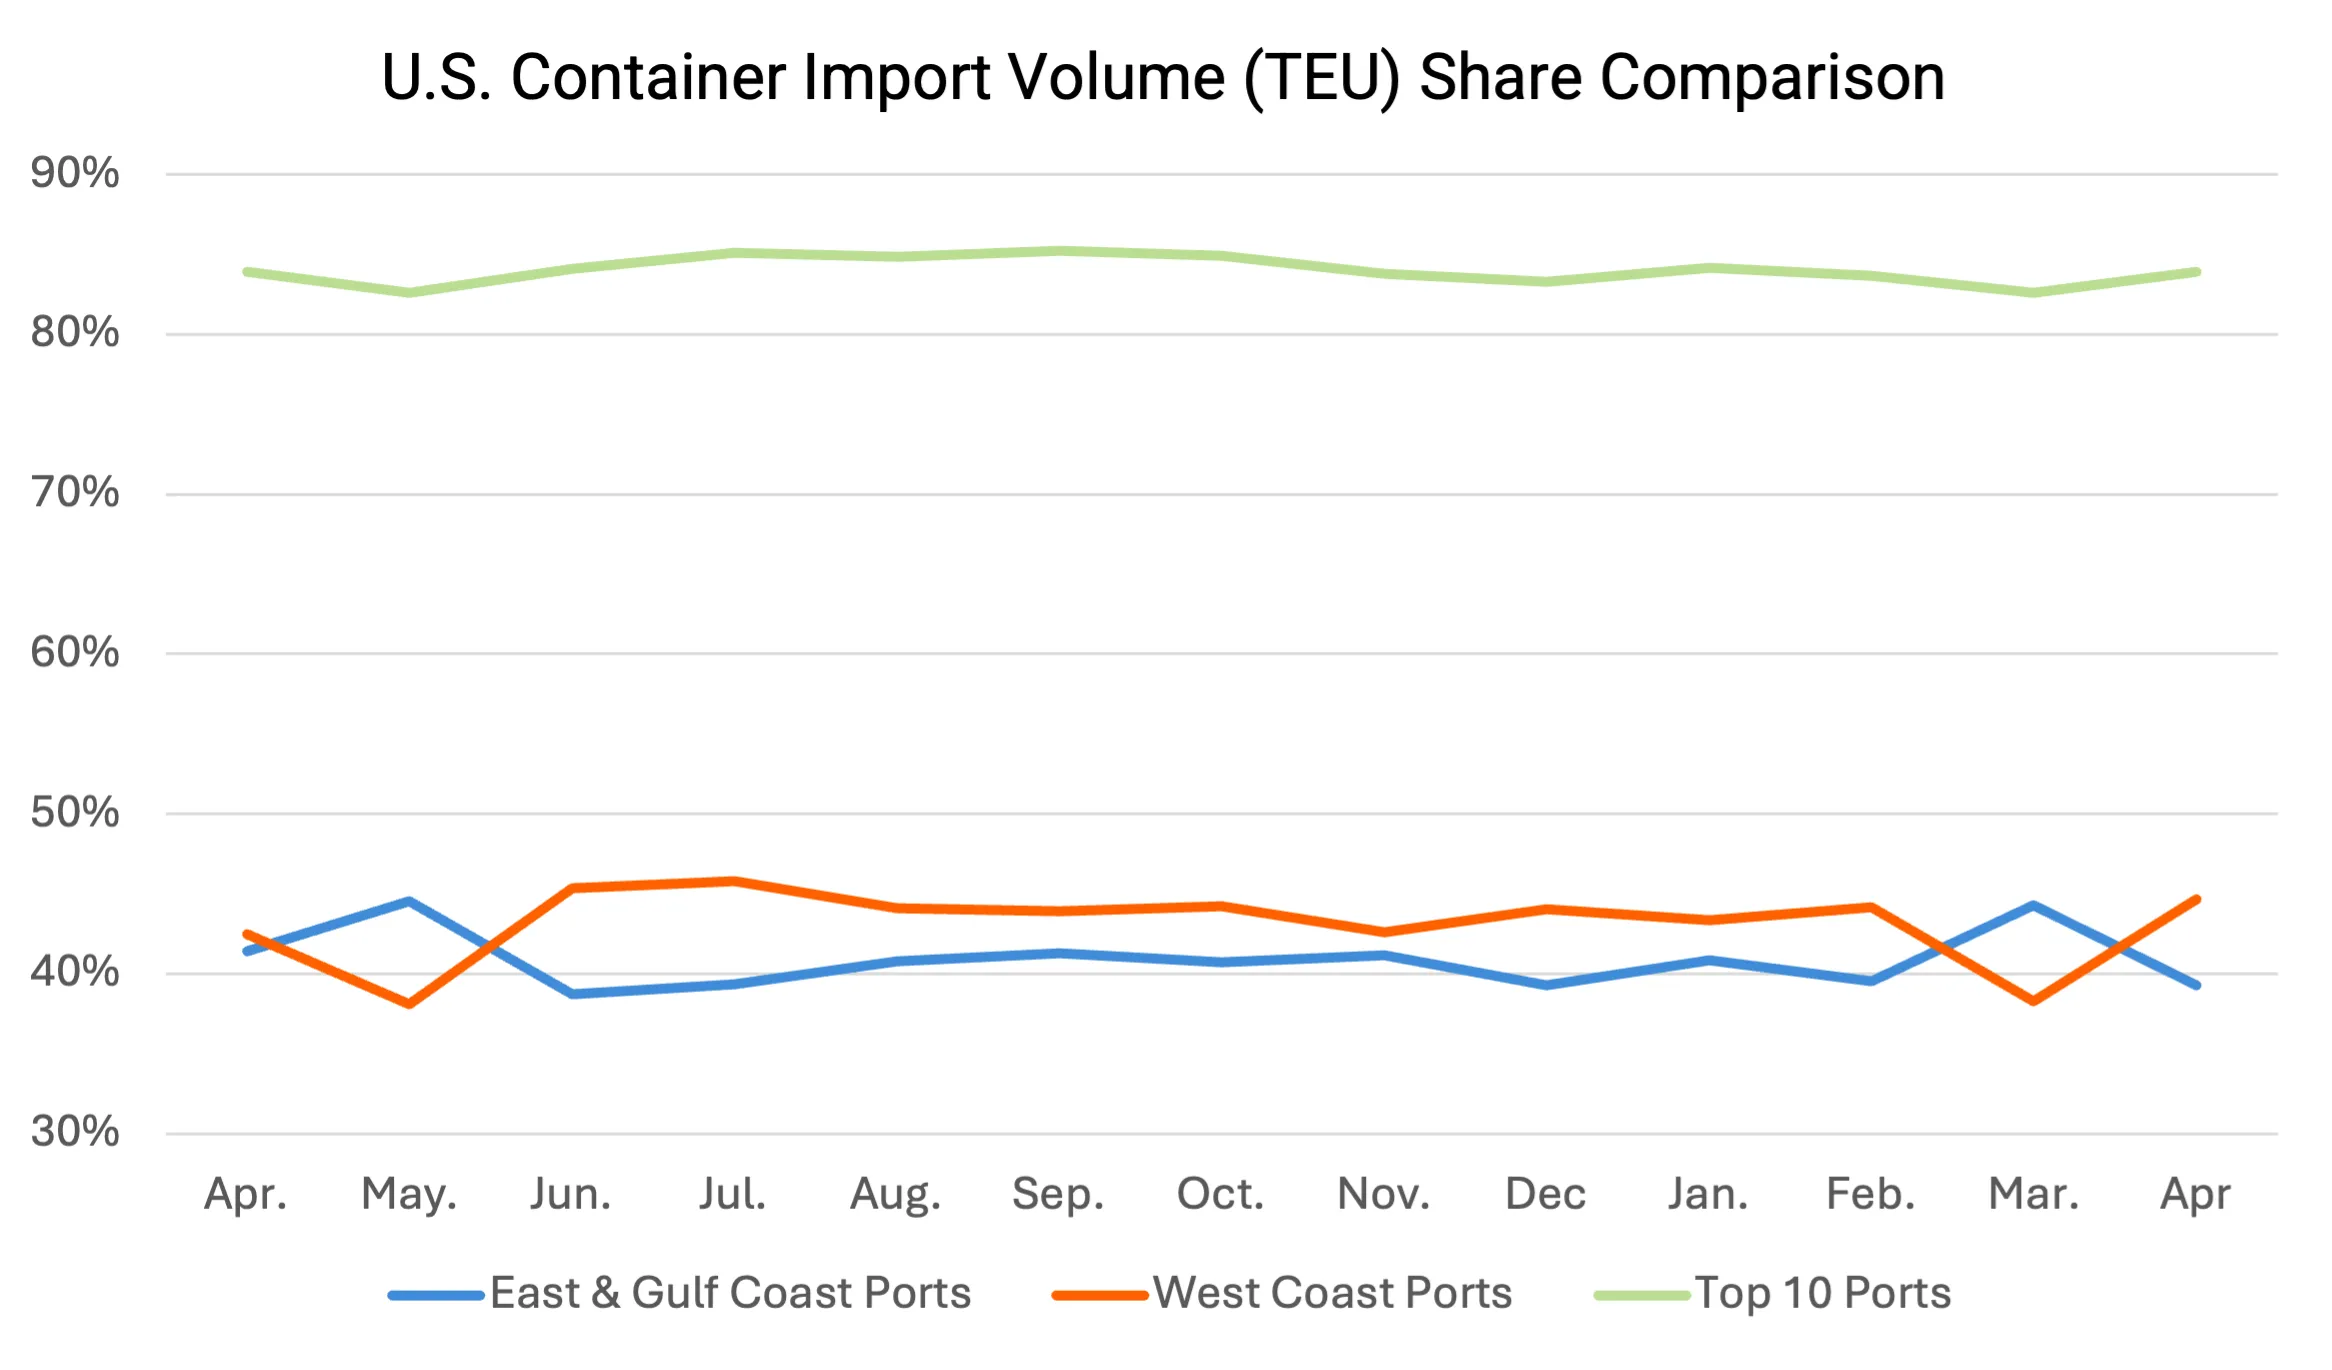
April 2026 U.S. container import shares shifted notably from March (see Figure 8). West Coast ports regained the lead in market share, accounting for 44.6% of total imports, up from 38.3% in March. Meanwhile, East and Gulf Coast ports saw their combined share decline to 39.2%, down from 44.3% the prior month. The top 10 U.S. ports handled 83.9% of total containerized imports in April, up from 82.6% in March, indicating a slight reconsolidation of volume among the largest gateways. Overall, April results reflect a rebalancing of import flows back toward West Coast ports following a brief shift toward East and Gulf Coast gateways in March.
Figure 8: Volume Analysis for Top Ports, West Coast Ports and East and Gulf Coast Ports
Source: Descartes Datamyne™
Port delays improve broadly with isolated disruption at Long Beach.
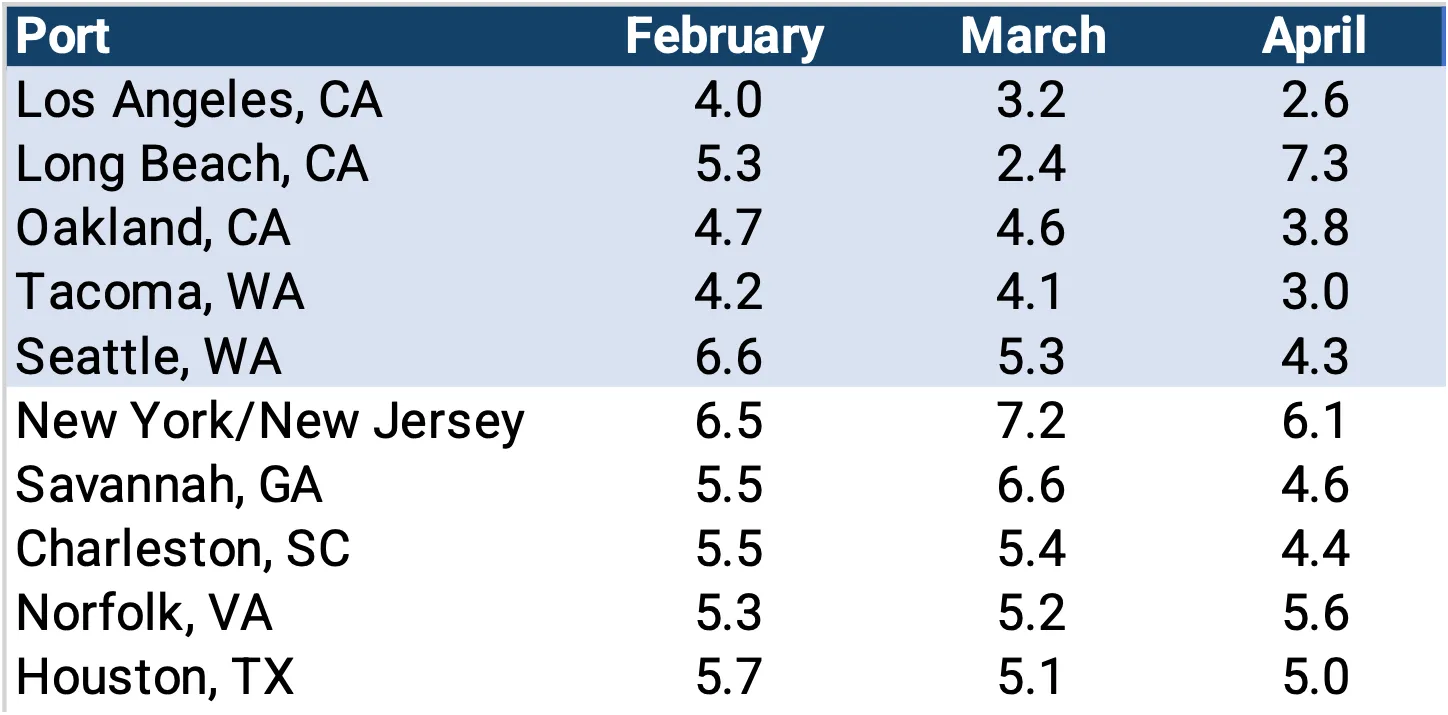
In April 2026, port transit delays showed broad-based improvement compared with March, with most major gateways reporting faster processing times (see Figure 9). On the West Coast, Los Angeles improved from 3.2 to 2.6 days and Oakland from 4.6 to 3.8 days. Pacific Northwest ports also continued to ease, with Tacoma dropping from 4.1 to 3.0 days and Seattle improving from 5.3 to 4.3 days. Long Beach was the notable exception, where delays surged from 2.4 to 7.3 days, indicating localized congestion. Across the East and Gulf Coasts, delays also trended downward. New York/New Jersey improved from 7.2 to 6.1 days, Savannah from 6.6 to 4.6 days, and Charleston from 5.4 to 4.4 days. Houston remained stable at 5.0 days, while Norfolk saw a modest increase from 5.2 to 5.6 days. Overall, April data points to improving port efficiency across most regions, with minimal signs of widespread congestion.
Figure 9: Monthly Average Transit Delays (in days) for the Top 10 Ports (Feb – Apr 2026)
Source: Descartes Datamyne™
Note: Descartes’ definition of port transit delay is the difference as measured in days between the Estimated Arrival Date, which is initially declared on the bill of lading, and the date when Descartes receives the U.S. Customs and Border Protection (CBP) processed bill of lading data.
Trusted by
Global Shipping Report Archive
Stay informed with monthly shipping insights with the Global Shipping Report

Director, Industry Strategy, Global Trade Intelligence, Descartes

April sees pullback in Gulf Coast container imports following March rebound.
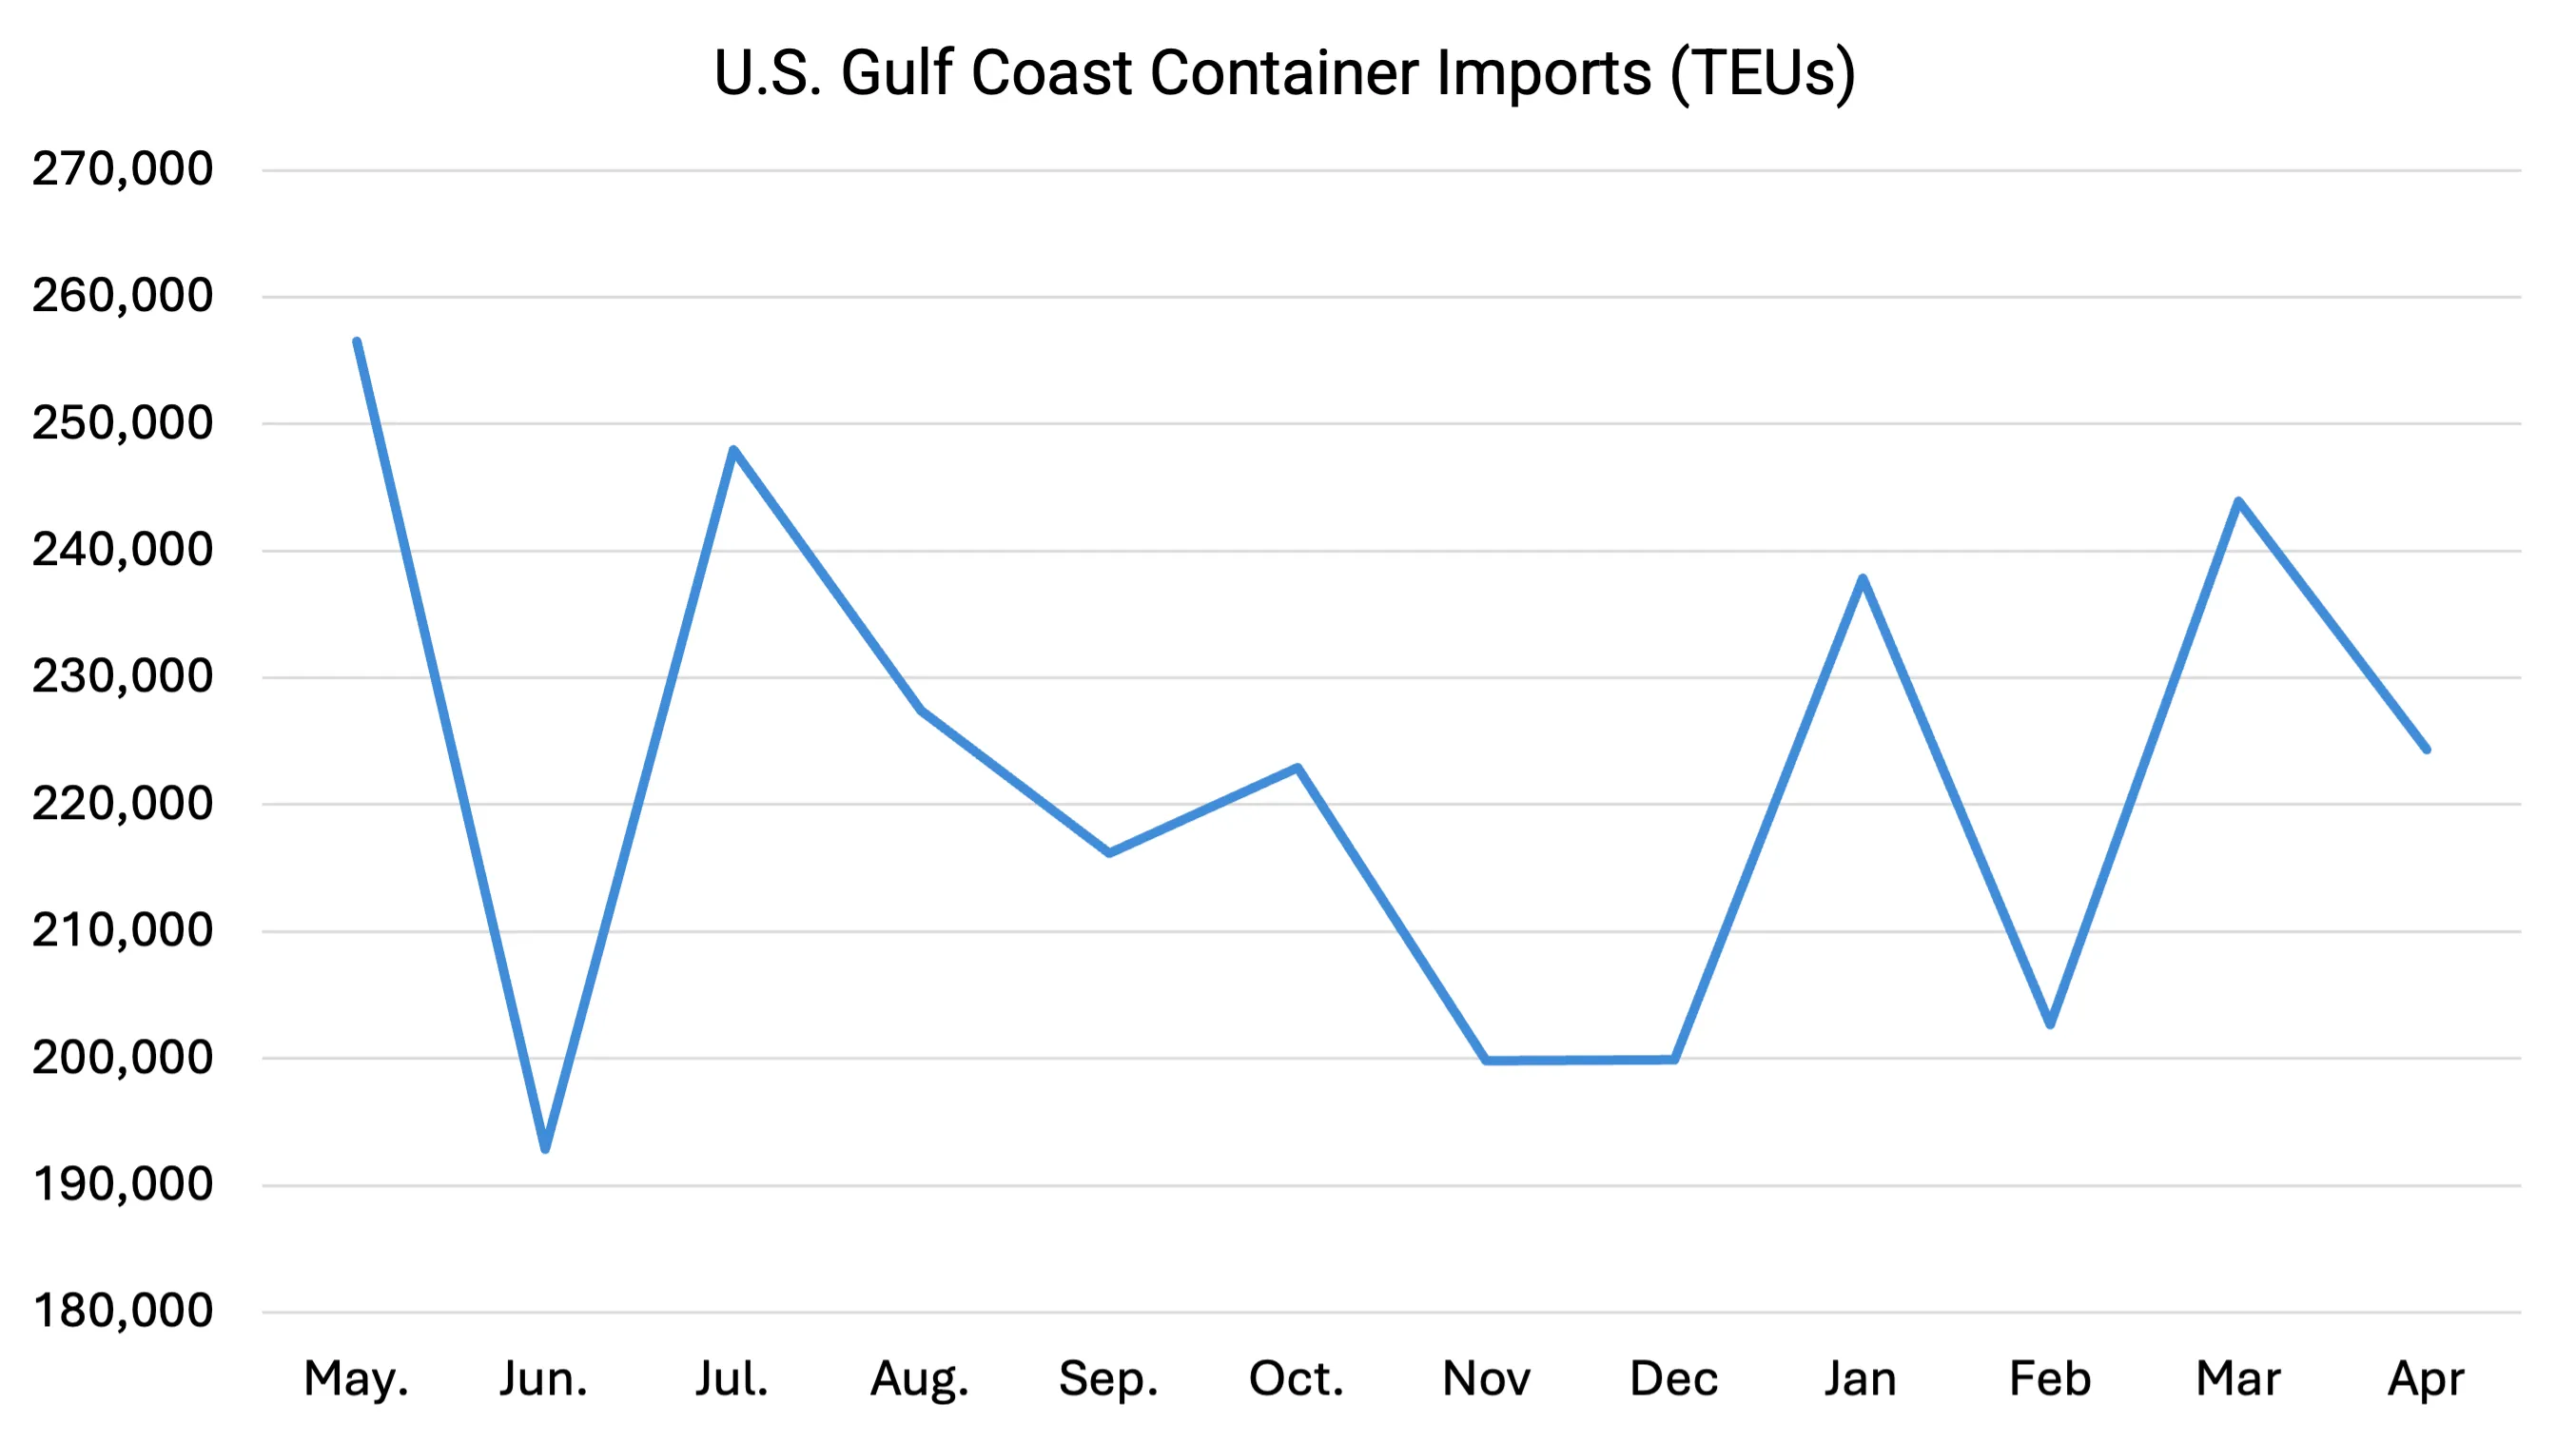
In April 2026, Gulf Coast container imports totaled 224,373 TEUs, an 8.0% month-over-month decline (see Figure 10). Despite the decrease, volumes remained slightly above (0.8%) the rolling 12-month average of 222,698 TEUs, indicating activity is holding near recent trend levels.
Figure 10: March 2025 to April 2026 U.S. Gulf Coast Container Imports
Source: Descartes Datamyne™
Middle East tensions continue to threaten critical maritime chokepoints and global trade flows.
Despite a fragile ceasefire established in early April, tensions between the U.S. and Iran re-intensified in early May, particularly around control of the Strait of Hormuz—one of the world’s most vital energy and shipping corridors. Maritime traffic through the Strait of Hormuz remains significantly constrained, with overlapping controls effectively limiting transit. Vessel movement is increasingly dictated by nationality, cargo type, and geopolitical alignment. Many shipping lines are avoiding the region entirely, while others are relying on naval escorts—adding complexity, cost, and uncertainty to voyage planning. The implications for global trade are substantial. The Strait of Hormuz handles roughly 20% of global oil flows, and disruptions have already driven higher energy prices. Extended transit times and constrained vessel availability are contributing to rising freight rates and ongoing network disruption.
For U.S. trade, the impact is more targeted than broad but still significant. Descartes Datamyne™ analysis shows that U.S. imports transiting the Strait of Hormuz are heavily concentrated in energy, fertilizer, and aluminum products. While these goods represent a smaller share of total containerized imports, they are disproportionately important to downstream supply chains. Disruptions to these flows can create ripple effects across multiple industries, including manufacturing, automotive, construction, and consumer goods.
While diplomatic efforts remain ongoing, the current operating environment points to sustained volatility. Even without a full closure of the Strait of Hormuz, the combination of military risk, restricted transit, and carrier avoidance behavior is enough to materially disrupt global shipping flows, increase costs, and amplify supply chain risk.
EU–U.S. trade tensions resurface as tariff disputes threaten deal stability.
In April and early May 2026, EU–U.S. trade tensions increased as the EU urged the U.S. to uphold prior agreements amid concerns over potential new tariffs. While a trade framework was approved in March, implementation remains uncertain, and the risk of retaliatory measures persists. The situation adds to ongoing volatility in transatlantic trade and cost planning.
U.S.–India trade talks remain constructive but progress toward a deal is gradual.
In April 2026, U.S.–India trade negotiations showed continued engagement following a meeting in Washington. Talks focused on key issues including market access, non-tariff barriers, and technical trade measures, with both countries agreeing to continue negotiations toward an interim agreement. However, no concrete timeline or final terms have been established, reflecting ongoing complexity in aligning tariff structures and trade priorities. While the continued dialogue supports long-term diversification potential, near-term impacts on trade flows remain limited as negotiations progress incrementally.
U.S.–China trade discussions resume but uncertainty persists.
U.S. and China trade officials held a “candid” call in late April 2026 ahead of a planned leadership summit, signaling renewed engagement. However, tensions remain over tariffs and supply chain policies, with no concrete changes announced. As a result, uncertainty continues to weigh on sourcing decisions and global trade flows.
Tariff refunds targeted to begin on May 12, offering potential relief but sustaining uncertainty.
The U.S. Customs and Border Protection (CBP) agency indicated refunds of previously collected tariffs will start May 12, 2026, following the Supreme Court ruling that invalidated IEEPA-based duties. While refunds may provide a short-term cash flow boost for importers, replacement tariffs remain in effect, meaning overall cost pressures and policy uncertainty persist.
Managing supply chain risk: what to watch in 2026.
In April 2026, U.S. container imports totaled 2.28M TEUs, down 3.2% from March and 5.5% year-over-year. Volumes remained elevated versus pre-pandemic levels, standing 18.7% above April 2019, but year-to-date imports continue to trail 2025. China-origin imports fell to 680,778 TEUs, down 4.3% from March, 15.3% year-over-year, and 33.4% below the July 2024 peak. Top CoO volumes declined 3.1% month-over-month and 6.3% year-over-year, with China driving the decreases. Looking ahead, trade conditions remain shaped by geopolitical disruption, tariff uncertainty, and a still-cautious macroeconomic environment. Together, these factors suggest that supply chain strategies in 2026 remain focused on flexibility, cost control, and risk mitigation.
Here’s what Descartes is monitoring in the months ahead:
- Middle East conflict and maritime security risk. Escalating tensions in the Middle East have further disrupted global shipping, with the Strait of Hormuz effectively restricted and growing threats to the Bab al-Mandeb raising the risk of broader disruption across both energy and container trade routes. While a ceasefire announced on April 7 may offer tentative signs of de-escalation if it holds, carriers continue to reroute vessels away from high-risk zones, increasing transit times, fuel costs, and schedule volatility.
- Expanded tariffs and other potential 'protectionist' trade policies. Tariff uncertainty remains a central planning challenge for importers. The first refunds of invalidated Trump-era tariffs are expected to begin in May, providing some cash-flow relief, but replacement measures and unresolved trade negotiations continue to weigh on cost predictability. The EU has urged the U.S. to reinstate trade-deal tariff commitments, U.S.–India talks remain constructive but unresolved, and U.S.–China officials recently held discussions ahead of a potential Trump-Xi summit.
- Port transit wait times. If they decrease, it's an indication of improved global supply chain efficiencies or that the demand for goods and logistics services is declining. April transit times improved across most major gateways, suggesting stable port performance and no widespread congestion. Long Beach was the major exception, with delays rising sharply while most other tracked ports improved or remained near recent ranges.
- The economy. The U.S. is an import-driven economy, so economic health is an important indicator of container import volumes. The Federal Reserve held the federal funds target range steady at 3.50%–3.75% at its April 29 meeting, while noting that future policy will depend on inflation, labor-market conditions, inflation expectations, and international developments. U.S. GDP grew at a 2.0% annualized rate in Q1 2026, rebounding from 0.5% in Q4 2025, but inflation and energy-price risks remain important watchpoints for import demand.
Consider recommendations to help minimize global shipping challenges.
April 2026 import volumes eased after March’s seasonal rebound but remained near historic levels, indicating continued resilience despite somewhat softer year-over-year performance. While port operations remain stable with improving transit times across most gateways, escalating geopolitical tensions in the Middle East, evolving U.S. tariff policy, and shifting global trade dynamics are increasing uncertainty around routing, costs, and sourcing decisions. Descartes continues to monitor these developments through Descartes Datamyne™, government releases, and industry intelligence to help organizations anticipate disruption, manage cost exposure, and strengthen supply chain resilience in a volatile global trade environment.
Short-term:
- Monitor developments related to Middle East tensions, particularly risks to the Strait of Hormuz and continued instability in the Red Sea and Bab al-Mandeb. While efforts to maintain vessel transit are ongoing, carriers remain cautious, with rerouting, higher war-risk premiums, and fuel volatility impacting transit times and costs.
- Track the anticipated rollout of tariff refunds following the invalidation of IEEPA-based duties, alongside continued implementation of temporary Section 122 tariffs. While refunds may improve importer liquidity, overlapping tariff regimes continue to create cost uncertainty ahead of the late July 2026 expiration window.
- Monitor fuel price volatility and carrier surcharges driven by geopolitical risk, particularly as disruptions to key energy corridors influence bunker costs and shipping rates.
- Watch for developments tied to U.S.–China engagement ahead of potential high-level negotiations, though no immediate tariff changes have been announced.
- Continue monitoring enforcement and compliance risks tied to sanctions and country-specific trade measures impacting energy and industrial supply chains.
Near-term:
- Monitor EU–U.S. trade tensions as recent developments raise the risk of renewed tariff actions despite prior agreement progress. Watch for retaliatory measures or policy shifts that could impact transatlantic trade flows.
- Track progress in U.S.–India trade negotiations, which remain constructive but unresolved, with potential implications for diversification strategies and tariff structures.
- Assess broader impacts of tariff policy uncertainty, including potential extensions or revisions to Section 122 duties and ongoing importer refund processing.
- Monitor secondary impacts from sustained geopolitical disruptions on global shipping capacity, including continued rerouting, schedule reliability, and carrier network adjustments.
Long-term:
- Reevaluate sourcing and supplier concentration strategies to reduce reliance on high-risk or overexposed trade lanes. Increasing geopolitical fragmentation and trade policy volatility are reinforcing the need for diversified, flexible supply chain networks.
Notes:
- This report uses the initial compiled release of publicly available U.S. Customs and Border Protection (CBP) Bill of Lading (BOL) data for all U.S. ports, which provides a standard, official source of data for reporting on maritime trade. This data can be subject to modification later by CBP. The modified data can be seen in Descartes Datamyne™ where U.S. maritime records are processed daily. Descartes Datamyne is ISO 9001 certified.
- In Descartes Datamyne™, twenty-foot equivalent units (TEU) are calculated using a combination of container size and weight as declared on Bills of Lading filed with U.S. Customs and Border Protection (CBP).
Subscribe to the Global Shipping Report
Stay informed with the latest shipping trends and U.S. container import logistics data every month with the Descartes Global Shipping Report
About Descartes Datamyne
Leverage the Power of Global Import and Export Trade Data
Optimize trade lanes, expand into new markets, discover alternative buyers and suppliers, as well as spot supply and demand shifts from a single integrated web-based platform to cost-effectively enhance your supply chain resilience and competitive edge.
Special Reports
2026 Top 30 U.S. Port Report
See how tariffs, routing choices, and sourcing strategies quietly reshaped the U.S. imports, and what those changes mean for 2026.
Download the 2026 Top 30 U.S. Port Report

A Year of Evolving U.S. Tariffs Reshapes Trade in Plastics
A surge in Transpacific plastic imports boosted U.S. port volumes in 2025, according to Descartes Datamyne™. Tariffs drove supply chain shifts for plastic goods, materials, and machinery.
Read the Report
An Analysis of U.S. Import Volumes Transiting Through the Strait of Hormuz
While the Strait of Hormuz accounts for a relatively small share of total U.S. maritime imports, the data shows that exposure is highly concentrated in critical commodities.
Read the Report
How Descartes Can Help
Descartes Datamyne delivers business intelligence with comprehensive, accurate, up-to-date, import and export information.
Our multinational trade data assets can be used to trace global supply chains and our bill-of-lading trade data – with cross-references to company profiles and customs information – can help businesses identify and qualify new sources. Ask us for a free, no obligation demonstration of our data on a product or trade commodity of your choosing – and keep the custom research we create with our compliments.