The Global Shipping Report
February U.S. Container Imports Post Seasonal Decline as Geopolitical Risks Intensify
Stay informed with the latest insights from the Descartes Global Shipping Report
Data for the Global Shipping Report provided by Descartes Datamyne
In February 2026, U.S. containerized imports declined 9.7% from January and were down 6.5% compared to February 2025. While February volumes declined on both a month-over-month and year-over-year basis, they reflect typical seasonal patterns and remained in line with the post-pandemic average for the month, suggesting underlying demand remains relatively stable despite ongoing policy uncertainty.
After posting a 9.3% month-over-month increase in January, container imports from China declined 5.5% in February. Month-over-month volumes from the top 10 countries of origin (CoO) were also down in February, decreasing by 9.4% compared to January’s increase of 7%. Although Southeast Asia remains a structural growth contributor, gains from the region were insufficient to offset wider sourcing declines.
At the same time, the broader trade environment grew more complex in February. The outbreak of war in the Middle East has significantly escalated tensions, reintroducing acute risk across key maritime corridors, including the Strait of Hormuz and Red Sea. Heightened security concerns, vessel rerouting, and rising risks have delayed hopes for sustained route normalization and is increasing cost uncertainty for carriers and shippers. In parallel, shifts in U.S. tariff authority following a Supreme Court ruling, continued transatlantic trade friction, expanded tariff policies linked to Cuban oil trade, and the implementation of a revised U.S.–India trade framework reinforce a global trade policy landscape that remains in flux.
In this Article...
- U.S. container imports reached 2,093,422 TEUs in February 2026.
- February 2026 imports decreased by 9.7% over January and were 6.5 % lower than February 2025.
- February 2026 imports from China were 728,562 TEUs, down 5.5% from January and 28.8% below the record high of 1,022,913 TEUs set in July 2024.
- February 2026 U.S. imports from the top 10 countries of origin (CoO) decreased by 9.4% over January.
- In February 2026, market share at West Coast ports increased, while the share at East and Gulf Coast ports declined modestly.
- February 2026 port transit delays showed mixed but moderate changes, with increases at several major West Coast gateways offset by improvements in the Pacific Northwest and Gulf Coast, and no signs of widespread congestion.
- The outbreak of war in the Middle East has significantly heightened risk across the Strait of Hormuz and Red Sea corridors.
- Supreme Court action reshapes U.S. tariff authority, creating refund uncertainty while replacement duties sustain elevated import costs and ongoing volatility for shippers.
- EU ratification of the U.S.–EU trade agreement remains on hold, prolonging transatlantic policy uncertainty and limiting near-term tariff relief.
- Implementation of revised U.S.–India tariff terms improves cost predictability and may gradually support bilateral trade flows.
- Key points to monitor and manage supply chain risks.
- Recommendations to help mitigate global shipping challenges.
February U.S. container imports decline month-over-month but remain seasonally resilient.
U.S. containerized imports totaled 2,093,422 TEUs in February 2026, down 9.7% from January and 6.5% compared to February 2025 (see Figure 1). Even with the decreases, volumes were typical of February levels observed post-pandemic and remained 17.0% above February 2019. Unlike February 2025, when frontloading likely inflated volumes, February 2026 activity appears more reflective of a normalized trade environment, with importers operating within ongoing policy uncertainty rather than accelerating shipments in anticipation of it.
Figure 1: U.S. Container Import Volume Year-over-Year Comparison
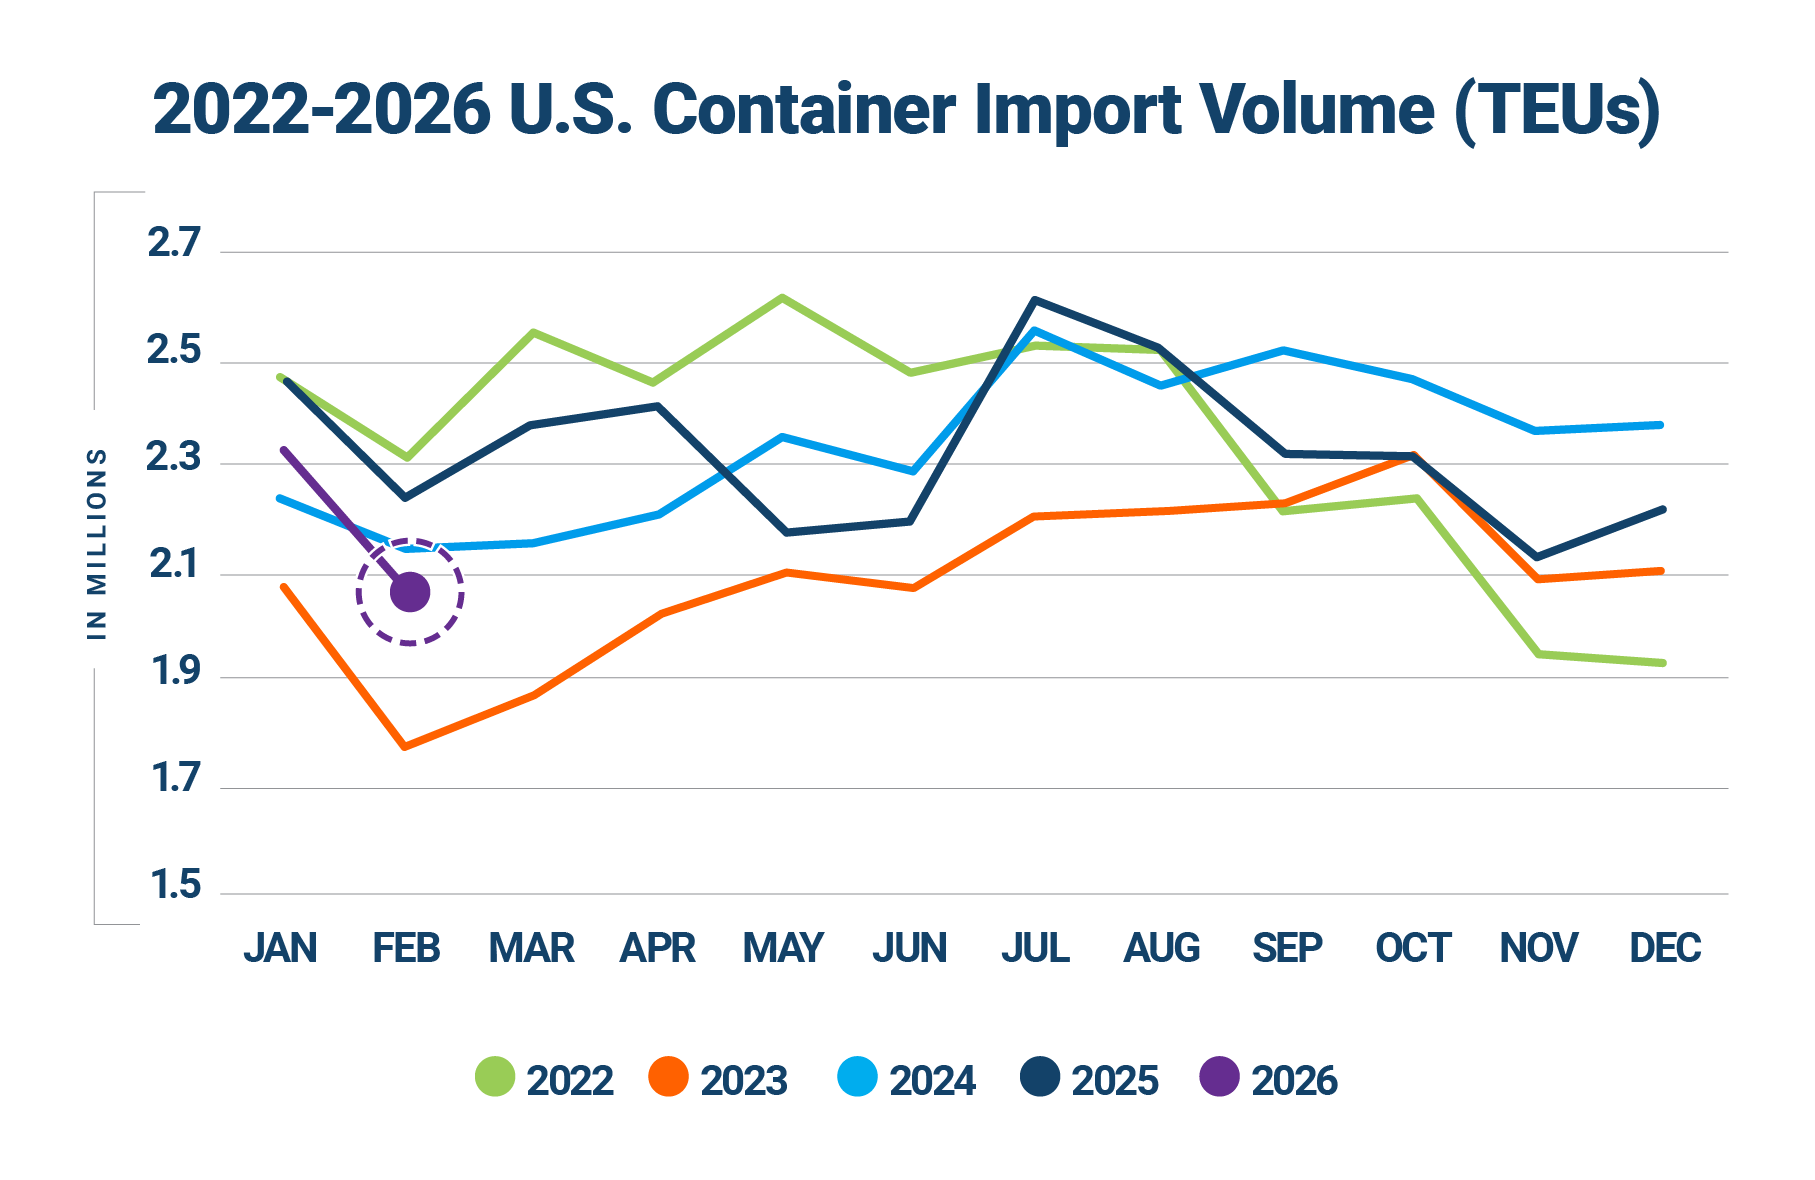
Source: Descartes Datamyne™
February 2026 import volumes were down 9.7% from January, a decrease of 225,301 TEUs (see Figure 2), continuing the typical seasonal pattern of month-over-month declines. Despite the pullback, February 2026 ranks as the fourth-strongest February on record. This performance underscores the relative resilience of U.S. import demand even amid ongoing policy and economic uncertainty.
Figure 2: January to February U.S. Container Import Volume Comparison

Source: Descartes Datamyne™
Volumes at top 10 U.S. ports decline in February.
Container volumes across the top 10 U.S. ports decreased by 193,167 TEUs in February 2026, a 9.9% month-over-month decline (see Figure 3). Performance across individual ports was broadly negative, with Los Angeles posting the only gain (3,373 TEUs). Substantial declines were reported at several major gateways. New York/Newark posted the largest volume drop, falling 16.6% (53,685 TEUs), followed by Long Beach, 11.5% (46,026 TEUs). Additional decreases were observed at Houston (18.9%), Oakland (26.7%), Norfolk (13.2%), Charleston (7.1%), Tacoma (7.9%), Miami (7.4%), and Savannah (4.2%).
Figure 3: January 2026 to February 2026 Comparison of Import Volumes at Top 10 U.S. Ports

Source: Descartes Datamyne™
China-origin import volumes decline across most major product categories.
U.S. containerized imports from China totaled 728,562 TEUs in February 2026, down 5.5% month-over-month (see Figure 4), lower by 16.5% year-over-year, and 28.8% below the July 2024 peak. China’s share of total U.S. container imports increased marginally to 34.8%. China’s import mix in February 2026 remained concentrated in consumer goods and key industrial inputs. Furniture and bedding (HS-94) remained the largest category at 122,919 TEUs, accounting for 16.9% of China-origin imports, even as volumes declined 18.5% compared to February 2025. Plastics (HS-39) ranked second at 116,582 TEUs, representing 16.0% of total volume and marking the only major top category to post growth, rising 11.5% year-over-year. Machinery (HS-84) and electrical machinery (HS-85) together represented 17.7% of total volume (10.4% and 7.3%, respectively), though both categories recorded significant year-over-year declines of 26.2% and 21.1%. Discretionary and consumer-oriented categories continued to represent a smaller share of overall imports. Apparel, footwear and other textiles (HS-61, HS-62, HS-63, HS-64) combined accounted for 8.5% of total volume, with footwear (HS-64) experiencing one of the steepest percentage declines, down 33.3% year-over-year. Toys and sporting goods (HS-95) represented 6.3% of imports, declining 14.8% compared to last year. Overall, imports from China experienced broad-based volume softness across most segments.
Figure 4: February 2025–February 2026 Comparison of U.S. Total and Chinese TEU Container Volume Relative to Chinese Import Record

Source: Descartes Datamyne
China-origin volumes decline across most major U.S. ports in February.
Port-level China-origin performance in February was broadly negative, with declines across six of the top 10 gateways, contributing to an overall 4.9% drop (35,183 TEUs). Long Beach posted the largest volume decline, falling 8.2% (17,872 TEUs), while New York/Newark decreased 14.3% (12,655 TEUs). Additional declines were observed at Houston (17.8%), Oakland (22.4%), Charleston (13.0%), and Norfolk (3.6%). Gains were limited to four ports. Los Angeles rose 5.7% (10,592 TEUs), New York 56.0% (4,188 TEUs), Tacoma 2.3% (553 TEUs) and Savannah 0.7% (473 TEUs). Overall, February’s results suggest uneven China-origin import activity across major gateways, with softness concentrated at several key West Coast and Gulf ports.
Figure 5: January 2026 to February 2026 Comparison of top U.S. Ports for Imports Originating from China

Source: Descartes Datamyne
Top countries of origin (CoO) volumes decline in February, with broad-based decreases across Asia.
In February 2026, U.S. containerized imports from the top 10 CoO fell 9.4% month-over-month, representing a combined decline of 156,656 TEUs (see Figure 6). Losses were widespread across major sourcing countries. China recorded the largest volume decline, down 5.5% (42,531 TEUs). Vietnam decreased 11.6% (33,542 TEUs), Thailand 19.9% (24,038 TEUs), India 17.5% (18,093 TEUs), and South Korea 17.0% (15,261 TEUs). Additional decreases were recorded from Indonesia (15.1%), Japan (15.8%), and Taiwan (14.7%). Only two countries posted gains in February. Germany increased 5.5% (2,510 TEUs), and Hong Kong edged up 0.4% (303 TEUs). Overall, February’s results reflect broad-based softness across leading Asian sourcing markets, contributing to the overall pullback in U.S. containerized import volumes.
Figure 6: January 2026 to February 2026 Comparison of U.S. Import Volumes from Top 10 Countries of Origin

Source: Descartes Datamyne
China-origin imports remain the primary drag on year-over-year CoO performance.
In February 2026, U.S. containerized imports from the top 10 CoO declined 7.3% year-over-year, representing a combined decrease of 118,945 TEUs (see Figure 7). As in prior months, the contraction was driven primarily by China, which more than accounted for the overall net decline among the top CoO. Additional year-over-year decreases were recorded from India (17.0%), South Korea (14.6%), Taiwan (12.5%), Germany (5.4%), and Japan (4.1%). In contrast, several Southeast Asian origins continued to post strong year-over-year growth. Thailand increased 30.8% (22,750 TEUs), Vietnam 13.9% (31,284 TEUs), Indonesia 15.5% (6,951 TEUs), and Hong Kong 9.7% (6,149 TEUs).
February’s results reinforce the ongoing divergence in sourcing patterns. While expanding volumes from Southeast Asia continue to offset a portion of the sustained decline in China-origin imports, they remain insufficient to fully counterbalance China’s contraction.
Figure 7: February 2025 to February 2026 Comparison of U.S. Import Volumes from Top 10 Countries of Origin

Source: Descartes Datamyne™
Coast-to-coast import shares shift modestly in February, with West Coast widening its lead.
In February 2026, U.S. container import shares shifted slightly from January levels (see Figure 8). East and Gulf Coast ports accounted for 39.5% of total imports, down from 40.8% in January. Meanwhile, West Coast ports increased their share to 44.2%, up from 43.4% the prior month, widening the month-over-month lead over East and Gulf Coast gateways and marking the ninth consecutive month with the greater market share. The top 10 U.S. ports handled 83.6% of total containerized imports in February, down modestly from 84.2% in January.
Figure 8: Volume Analysis for Top Ports, West Coast Ports and East and Gulf Coast Ports

Source: Descartes Datamyne™
Port delays remain stable with slight adjustments.
In February 2026, port transit delays showed modest month-over-month adjustments compared with January (see Figure 9). On the West Coast, Los Angeles delays increased from 3.0 to 4.0 days, Long Beach rose from 2.8 to 5.3 days, and Oakland went from 4.1 to 4.7 days. In contrast, Pacific Northwest ports improved, with Tacoma delays declining from 5.0 to 4.2 days and Seattle easing from 7.8 to 6.6 days. Across the East Coast, changes were mixed but generally moderate. New York/New Jersey edged up slightly from 6.4 to 6.5 days, Norfolk increased from 5.0 to 5.5 days, while Houston delays declined from 6.6 to 5.7 days. Overall, February’s data indicates moderate fluctuations with no evidence of widespread capacity strain across major U.S. ports.
Figure 9: Monthly Average Transit Delays (in days) for the Top 10 Ports (Dec. 2025 – Feb. 2026)

Source: Descartes Datamyne™
Note: Descartes’ definition of port transit delay is the difference as measured in days between the Estimated Arrival Date, which is initially declared on the bill of lading, and the date when Descartes receives the U.S. Customs and Border Protection (CBP) processed bill of lading data.
Trusted by
Global Shipping Report Archive
Stay informed with monthly shipping insights with the Global Shipping Report

Director, Industry Strategy, Global Trade Intelligence, Descartes

February sees pullback in Gulf Coast container imports following January surge.
In February 2026, Gulf Coast container imports totaled 202,686 TEUs, a 14.8% month-over-month decline (see Figure 10). February volumes fell 9.2% below the rolling 12-month average of 223,117 TEUs, indicating activity moved back below recent trend levels.
Figure 10: March 2025 to February 2026 U.S. Gulf Coast Container Imports

Source: Descartes Datamyne™
Geopolitical escalation in the Middle East puts maritime trade and U.S. imports at risk.
The outbreak of war involving the U.S., Israel, and Iran has already disrupted key global shipping corridors and introduced significant uncertainty into maritime trade networks. The crisis has effectively halted commercial traffic through the Strait of Hormuz, a critical chokepoint for global energy shipments, after joint U.S.–Israeli strikes and Iranian retaliation led to warnings forbidding vessel passage and a collapse in transit volumes.
Maritime carriers are also rerouting around traditional chokepoints and adjusting network deployments. Several major ocean carriers have suspended transits through the Gulf and Red Sea regions, and ships originally bound for the Suez Canal are now detouring around the Cape of Good Hope, adding days to voyage times and increasing fuel and operational costs. These route changes have ripple effects across global schedules and freight rates.
For U.S. trade, the implications include heightened freight costs, longer transit times, and increased volatility in supply chains. Higher energy prices stemming from the disruption in the Persian Gulf can translate into elevated fuel and transportation costs for U.S. importers. Prolonged instability may also strain sourcing strategies for goods moving through affected regions, reinforcing the need for diversified routes and contingency planning.
Recent U.S. tariff rulings and replacements reshape import cost dynamics.
In February 2026, the U.S. Supreme Court struck down a large portion of the Trump administration’s sweeping reciprocal tariffs, ruling that the administration lacked constitutional authority to levy the tariffs under the International Emergency Economic Powers Act (IEEPA). This decision could expose the government to refund claims totaling up to an estimated $175 billion from importers who paid the now-invalidated duties.
In response, the administration rapidly replaced the invalidated tariffs by invoking Section 122 of the Trade Act of 1974, implementing a temporary 10% global tariff on imports with plans to raise it to 15%, effective for up to 150 days. At the same time, other tariffs based on different legal authorities, such as Section 232 national security duties on steel and aluminum, remain in place despite longstanding World Trade Organization challenges.
The net effect on U.S. imports has been mixed. While the original broad tariffs were effectively rolled back by the court, potentially lowering effective duty burdens and prompting importers and shippers to seek refunds, the replacement levies have sustained elevated tariff rates on many goods. The uncertainty has contributed to volatility in import cost structures, with some cost relief expected if refunds are issued, but continued elevated tariffs on key categories preserving higher costs for other imported goods.
Transatlantic trade tensions persist into February, prolonging policy uncertainty.
In February, the European Union maintained its suspension of the July 2025 U.S.–EU trade agreement, citing continued uncertainty surrounding U.S. tariff policy and broader geopolitical tensions. With ratification still on hold, tariff reductions envisioned under the agreement remain delayed, extending uncertainty for transatlantic trade flows.
U.S.–India tariff reductions take effect in February.
In February, the new U.S.–India trade framework was implemented, reducing elevated punitive tariffs on many Indian goods to a revised baseline of approximately 18%. While negotiations toward a broader bilateral agreement remain ongoing, the tariff adjustment improves cost predictability for importers and could support increased U.S.–India trade volumes in the months ahead as sourcing strategies shift.
U.S.–China trade measures remain stable in February.
In February, no new China-specific tariff increases or export control expansions were announced. After the Supreme Court ruling invalidated certain IEEPA-based tariffs, the administration shifted affected duties to temporary authority under Section 122 of the Trade Act of 1974, maintaining much of the existing tariff structure. As a result, the effective trade environment for U.S.–China flows remains largely unchanged, though legal uncertainty persists.
U.S.–Iran tensions raise maritime risk in key shipping lanes.
Recent friction between the U.S. and Iran has renewed concerns over maritime security in the Middle East, particularly around the Strait of Hormuz. Reports of Iranian naval activity and drone incidents near commercial and U.S.-flagged vessels highlight the ongoing risk of disruption in one of the world’s most critical energy shipping corridors. While shipping traffic continues to flow, any escalation could increase insurance costs, alter vessel routing, and heighten volatility for tanker and container movements transiting the Gulf, reinforcing the sensitivity of global maritime trade to geopolitical developments in the region.
Managing supply chain risk: what to watch in 2026.
In February 2026, U.S. container imports totaled 2.09M TEUs, down 9.7% from January and 6.5% year-over-year. Despite the decline, volumes ranked as the fourth-strongest February on record and remained in line with post-pandemic averages, signaling stable underlying demand. China-origin imports totaled 728,562 TEUs, nearly 29% below their July 2024 peak, and continued to weigh on overall performance. While several Southeast Asian origins posted year-over-year growth, total imports from the top 10 CoO declined on both a monthly and annual basis, reflecting broader sourcing softness.
Looking ahead, trade conditions are increasingly being shaped by geopolitical escalation and policy shifts. The outbreak of war in the Middle East has shut down the Strait of Hormuz and elevated risk in the Red Sea corridor, increasing routing and cost uncertainty. At the same time, changes to U.S. tariff authority, continued transatlantic trade friction, revised U.S.–India tariff terms, and expanded Cuba-linked tariff policies reinforce a policy landscape in flux. Together, these factors suggest that supply chain planning in 2026 will remain centered on risk management and flexibility amid elevated global uncertainty. Here’s what Descartes is monitoring in the months ahead:
- Middle East conflict and maritime security risk. The outbreak of war in the Middle East has sharply escalated security concerns across critical maritime corridors, including the Strait of Hormuz and Red Sea. Heightened military activity, vessel rerouting, and rising war-risk premiums have disrupted normal transit patterns, with many carriers suspending or delaying movements through affected areas. As a result, longer voyage distances, higher fuel and insurance costs, and increased schedule volatility are likely to persist while regional stability remains uncertain, reinforcing elevated risk across global shipping networks in 2026.
- Expanded tariffs and other potential ‘protectionist’ trade policies. Broader and deeper tariffs applied to a wide array of goods could compel U.S. importers to significantly re-engineer their supply chains, putting additional pressure on global logistics infrastructure. In February, the U.S. Supreme Court invalidated the administration’s IEEPA-based tariff regime, prompting a shift to temporary duties under Section 122 that largely preserved tariff exposure but added legal and cost uncertainty. China-origin imports remain well below prior peaks, reflecting the continued impact of long-standing U.S.–China trade measures. At the same time, implementation of the revised U.S.–India trade framework, including reduced punitive tariffs on Indian goods, may gradually influence sourcing patterns and bilateral trade flows. The continued suspension of the U.S.–EU agreement further extends policy uncertainty, reinforcing a trade environment shaped more by volatility than stability.
- Monthly TEU volumes between 2.4M and 2.6M. This level has historically been a key pressure point for U.S. ports and inland logistics networks. In February 2026, import volumes totaled 2.09M TEUs, down from January’s 2.32M TEUs and well below the 2.4M–2.6M threshold typically associated with elevated congestion risk. Although February volumes declined seasonally, they remained in line with post-pandemic averages, indicating a relatively balanced operating environment.
- Port transit wait times. If they decrease, it’s an indication of improved global supply chain efficiencies or that the demand for goods and logistics services is declining. In February 2026, transit times showed mixed but moderate adjustments across major U.S. gateways. Delays increased at several key West Coast ports, while conditions improved in parts of the Pacific Northwest and at select Gulf Coast locations. Overall, transit times remained within recent historical ranges, with no evidence of systemic congestion, indicating broadly stable port and inland logistics operations.
- The economy. The U.S. is an import-driven economy, so economic health is an important indicator of container import volumes. At its January 27–28, 2026 meeting, the Federal Reserve held the federal funds rate steady at 3.50%–3.75%, signaling a pause following late-2025 rate cuts as policymakers assess cooling labor conditions and persistent inflation. Recent employment data show slower job growth, pointing to moderating economic momentum. Together, steady interest rates, softer labor trends, and ongoing inflation pressures suggest a balanced but cautious economic backdrop that may limit near-term upside for U.S. import volumes as demand adjusts to slower growth conditions.
Consider recommendations to help minimize global shipping challenges.
February 2026 import volumes declined seasonally from January and remained below prior-year levels, but continued to track in line with post-pandemic levels. While port operations remain stable, the outbreak of war in the Middle East, evolving U.S. tariff authority, and ongoing trade tensions have increased routing, cost, and policy uncertainty for importers. Descartes continues to monitor these developments through Descartes Datamyne™, government releases, and industry intelligence to help organizations anticipate disruption, manage cost exposure, and strengthen supply chain resilience in a volatile global trade environment.
Short-term:
- Monitor developments related to the Middle East conflict, particularly impacts on the Strait of Hormuz and Red Sea corridors. Vessel rerouting and energy market volatility could materially affect transit times and costs.
- Track implementation of temporary tariffs under Section 122 following the Supreme Court’s invalidation of IEEPA-based duties. Ongoing litigation and potential refund claims create cost and compliance uncertainty for importers.
- Monitor enforcement actions and country designations under the expanded Cuba-linked tariff framework, particularly for indirect exposure across energy and manufacturing supply chains.
- While no new China-specific tariffs were introduced in February, long-standing Section 301 duties and export controls remain in force. Monitor for escalation, retaliatory measures, or legal shifts affecting cost structures.
Near-term:
- EU ratification of the U.S.–EU trade agreement remains suspended. Monitor for retaliatory actions or renewed negotiations that could alter tariff exposure or sourcing strategies.
- Monitor the implementation of the U.S.–India trade framework and its effects on bilateral trade.
- Monitor secondary impacts from energy-linked sanctions (including Cuba-related policy and broader regional instability) that may affect fuel costs and compliance requirements.
- Continue monitoring monthly TEU volumes relative to historical congestion pressure points (2.4M–2.6M TEUs) to assess potential stress on U.S. maritime and inland logistics infrastructure.
Long-term:
- Evaluate supplier and factory location density to mitigate reliance on over-taxed trade lanes and regions of the globe currently experiencing geopolitical conflict or that have the potential for conflict. Density creates economy of scale but also risk, and subsequent logistics capacity crisis highlights the downside.
Notes:
- This report uses the initial compiled release of publicly available U.S. Customs and Border Protection (CBP) Bill of Lading (BOL) data for all U.S. ports, which provides a standard, official source of data for reporting on maritime trade. This data can be subject to modification later by CBP. The modified data can be seen in Descartes Datamyne™ where U.S. maritime records are processed daily. Descartes Datamyne is ISO 9001 certified.
- In Descartes Datamyne™, twenty-foot equivalent units (TEU) are calculated using a combination of container size and weight as declared on Bills of Lading filed with U.S. Customs and Border Protection (CBP).
Subscribe to the Global Shipping Report
Stay informed with the latest shipping trends and U.S. container import logistics data every month with the Descartes Global Shipping Report
About Descartes Datamyne
Leverage the Power of Global Import and Export Trade Data
Optimize trade lanes, expand into new markets, discover alternative buyers and suppliers, as well as spot supply and demand shifts from a single integrated web-based platform to cost-effectively enhance your supply chain resilience and competitive edge.
Special Reports
2024 Top 30 U.S. Port Report
Stay informed with the annual U.S. Port Report from Descartes, ranking 2024 Maritime Port performance and trends in a year that defied expectations.
Download the 2024 Top 30 U.S. Port Report

What Companies are Doing to Tackle Escalating Global Supply Chain Challenges
Offering must-read insights for global trade, this white paper provides an overview of the key challenges facing global supply chain leaders as discovered through Descartes’ 2024 Global Trade Intelligence Survey.
Download the White Paper
How Descartes Can Help
Descartes Datamyne delivers business intelligence with comprehensive, accurate, up-to-date, import and export information.
Our multinational trade data assets can be used to trace global supply chains and our bill-of-lading trade data – with cross-references to company profiles and customs information – can help businesses identify and qualify new sources. Ask us for a free, no obligation demonstration of our data on a product or trade commodity of your choosing – and keep the custom research we create with our compliments.