
The Global Shipping Report
July U.S. Containerized Imports Rise Seasonally Amid Ongoing Trade Uncertainty
Stay informed with the latest insights from the Descartes Global Shipping Report
Data for the Global Shipping Report provided by Descartes Datamyne
U.S. containerized imports increased in July 2026, reaching 2,508,310 twenty-foot equivalent units (TEUs). Following the typical seasonal month-over-month increase, volumes rose 4.5% from June and were 4.3% below the near-record level recorded in July 2025, which narrowly missed the overall record set in May 2022. Through the first seven months of 2026, imports were down 0.9% year-over-year while remaining well above pre-pandemic levels.
China-origin imports rose to 873,129 TEUs in July, increasing 7.2% from June and reaching their highest monthly level since July 2025. Imports from the top 10 countries of origin (CoO) increased 4.9% from June but declined 5.3% year-over-year, with China accounting for roughly half of the annual decrease. Port activity strengthened across several major gateways. West Coast ports increased their share of total U.S. imports to 45.0%, while East and Gulf Coast ports accounted for 39.8%. Gulf Coast imports rose 13.8% from June and moved above their rolling 12-month average. Port transit delays increased across most major gateways, however, there were no signs of broad congestion.
The broader trade environment remains unsettled. Elevated Strait of Hormuz risk, changing U.S. tariff measures, tighter Panama Canal draft restrictions, and continued Red Sea disruption are influencing freight costs, routing decisions, and sourcing strategies. July’s results point to resilient seasonal demand but also highlight the operational and policy uncertainty importers continue to face through the second half of 2026.
In this Article...
- U.S. container imports reached 2,508,310 TEUs in July 2026.
- July 2026 imports increased by 4.5% over June and were 4.3% lower than July 2025.
- July 2026 imports from China were 873,129 TEUs, up 7.2% from June and down 5.4% from July 2025.
- July 2026 U.S. imports from the top 10 CoO increased by 4.9% over June and were down 5.3% over July 2025.
- Top 10 ports captured 84.8% of total imports in July.
- Port delays increased across most major U.S. gateways, while Los Angeles delays improved sharply.
- Gulf Coast imports increased by 13.8% in July and were 8.3% above the 12-month rolling average.
- Strait of Hormuz disruptions continue to threaten global shipping.
- Evolving U.S. tariff policies continue to add uncertainty to global trade.
- Lower Panama Canal draft limits add another layer of supply chain uncertainty.
- Red Sea disruptions continue to pressure global shipping capacity and freight rates.
- Key points to monitor and manage supply chain risks.
- Recommendations to help mitigate global shipping challenges.
July U.S. container imports follow seasonal increase.
U.S. containerized imports totaled 2,508,310 TEUs in July 2026, increasing 4.5% from June (see Figure 1). July imports were down 4.3% year over year; however, trade policy, combined with seasonal demand, led to suspected aggressive frontloading in July 2025 when volumes reached 2,621,910 TEUs. Compared to pre-pandemic 2019, July 2026 imports were up 14.1%, underscoring the continued strength of U.S. import demand amid ongoing trade policy and tariff uncertainty. For the first seven months of 2026, import volumes were 0.9% below the same period in 2025.
Figure 1: U.S. Container Import Volume Year-over-Year Comparison

Source: Descartes Datamyne™
Historically, July import volumes have increased over June, reflecting peak shipping season growth (see Figure 2). Following the seasonal trend, July 2026 increased 4.5% month-over-month. Overall results suggest that import demand remained resilient, with volumes adhering to typical seasonal patterns while moderating from last year's exceptional peak.
Figure 2: June to July U.S. Container Import Volume Comparison

Source: Descartes Datamyne™
July import volumes jump at the ports of Long Beach and Houston.
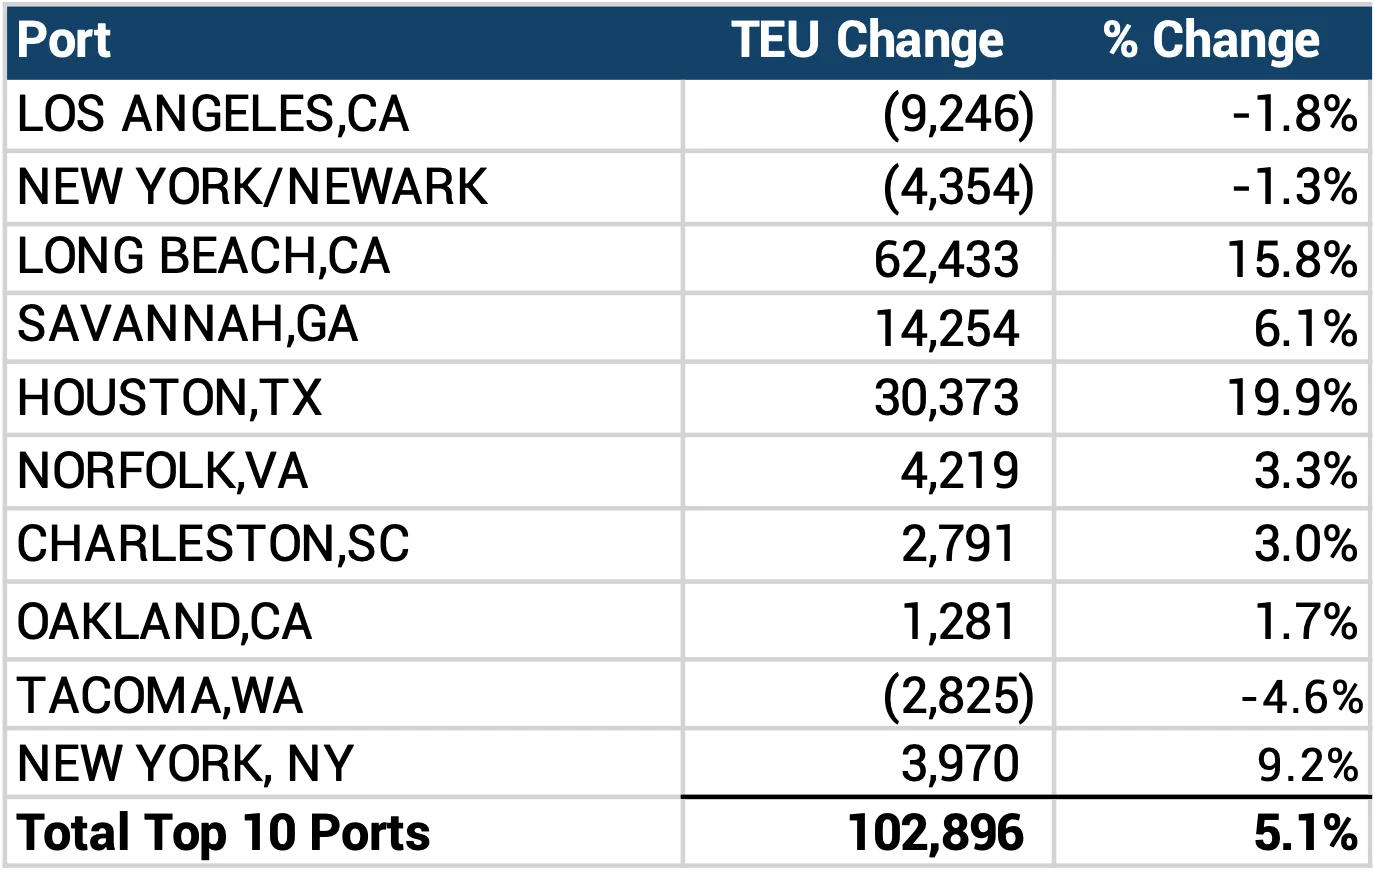
Container volumes across the top 10 U.S. ports increased by 102,896 TEUs in July 2026, a 5.1% month-over-month increase, with seven of the ten major gateways posting higher volumes compared to June (see Figure 3). Long Beach recorded the largest volume increase, rising 62,433 TEUs (15.8%), followed by Houston, up 30,373 TEUs (19.9%). Additional gains were reported at Savannah, up 14,254 (6.1%), Norfolk, up 4,219 TEUs (3.3%), New York, up 3,970 TEUs (9.2%), Charleston, up 2,791 TEUs (3.0%), and Oakland, up 1,281 TEUs (1.7%).
In contrast, volumes at three of the top 10 U.S. ports recorded declines. Los Angeles posted the largest decline, down 9,246 TEUs (1.8%), followed by New York/Newark, down 4,354 TEUs (1.3%), and Tacoma, which was down 2,825 TEUs (4.6%). July’s results suggest that import activity was not evenly distributed, with significant gains at Long Beach and Houston driving overall performance among the top 10 ports.
Figure 3: June 2026 to July 2026 Comparison of Import Volumes at Top 10 U.S. Ports
Source: Descartes Datamyne™
China-origin imports reach highest level since July 2025.
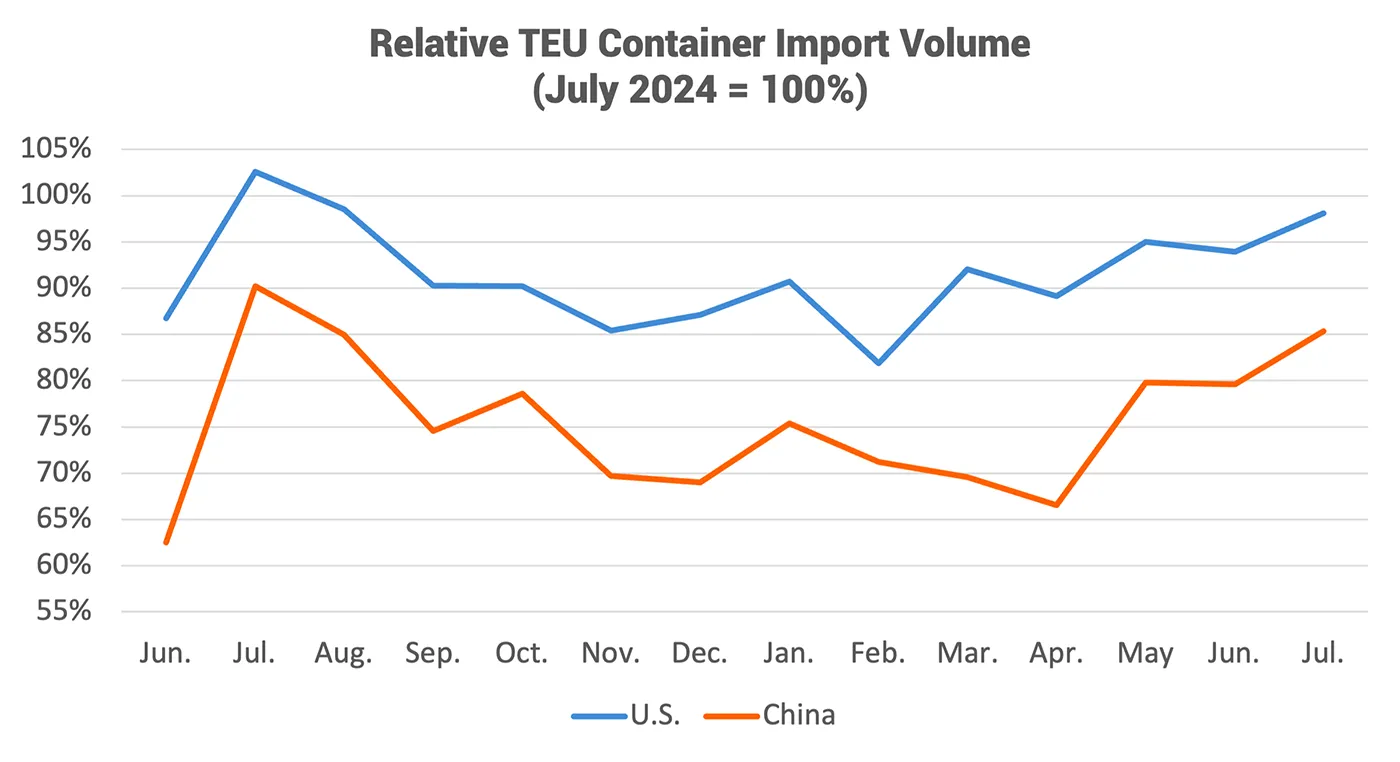
U.S. containerized imports from China totaled 873,129 TEUs in July 2026, increasing 7.2% over June to their highest monthly level since July 2025. Despite the month-over-month gain, volumes remained 5.4% below July 2025’s 923,075 TEUs and 14.6% below the July 2024 peak of 1,022,913 TEUs (see Figure 4). China's share of total U.S. containerized imports increased to 34.8%, up from 33.9% in June, indicating that China captured a slightly larger portion of overall U.S. import activity.
China’s July import mix continued to be led by plastics (HS-39) and furniture and bedding (HS-94), which accounted for 15.0% and 13.9% of total China-origin volume, respectively. Machinery (HS-84) and electrical machinery (HS-85) represented a combined 17.5% of imports, underscoring the continued importance of industrial equipment and manufacturing inputs. Consumer-oriented goods also remained prominent, with toys and sporting goods (HS-95) accounting for 8.3% of July volume, while apparel, textiles, and footwear (HS-61, HS-62, HS-63, and HS-64) collectively represented 10.6% of imports. Overall, July's import profile reflected continued demand across both consumer and industrial product categories, helping lift China-origin shipments to their highest monthly total since July 2025.
Figure 4: July 2025–July 2026 Comparison of U.S. Total and Chinese TEU Container Volume Relative to Chinese Import Record
Source: Descartes Datamyne
China drives July increase in imports from top sourcing countries.
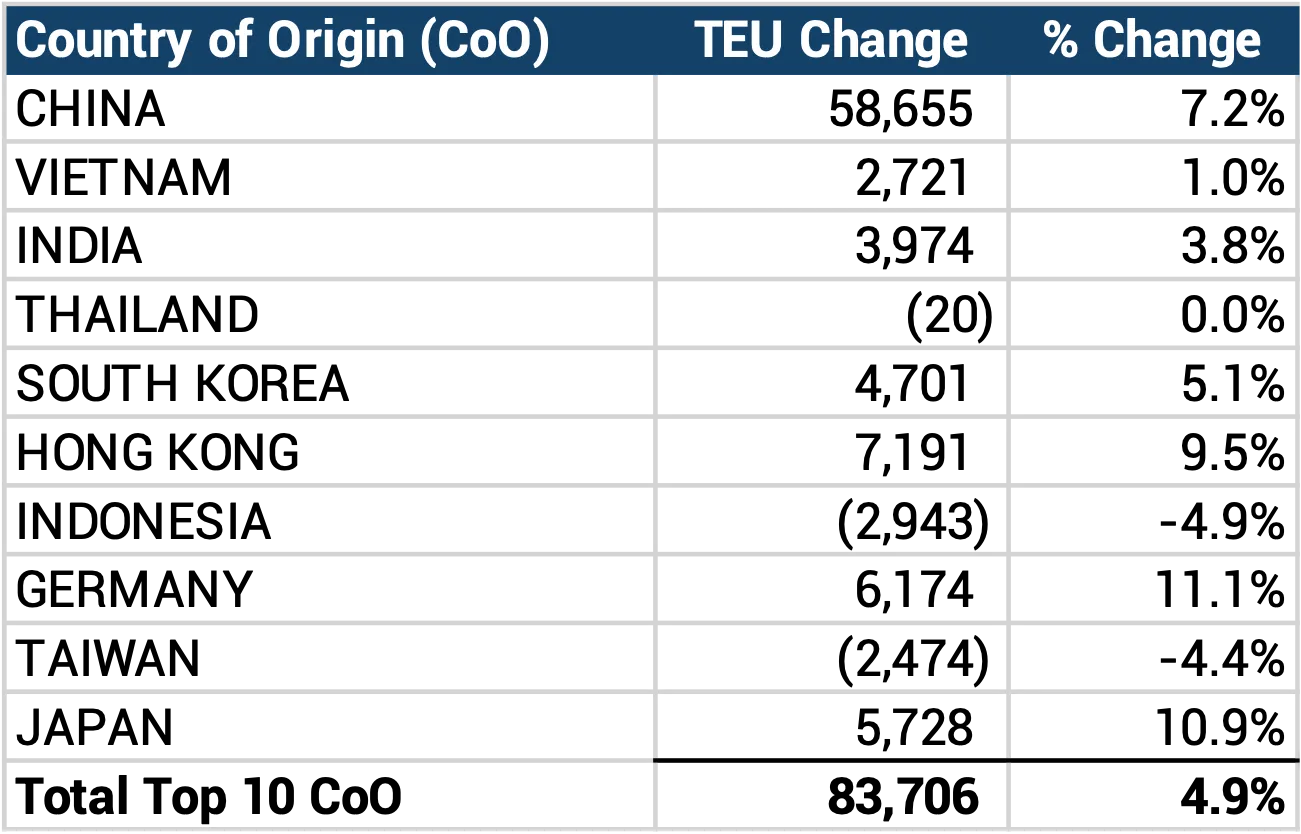
In July 2026, U.S. containerized imports from the top 10 CoO increased 4.9% month-over-month with a combined increase of 83,706 TEUs (see Figure 5). China recorded the largest volume gain, increasing 58,655 TEUs (7.2%) to its highest monthly total since July 2025. Other notable increases came from Hong Kong, up 7,191 TEUs (9.5%), Germany, up 6,174 TEUs (11.1%), Japan, up 5,728 TEUs (10.9%), South Korea, up 4,701 TEUs (5.1%), and India, up 3,974 TEUs (3.8%). Vietnam also posted a modest increase of 2,721 TEUs (1.0%), while Thailand was essentially unchanged. The only declines among the top 10 sourcing countries were Indonesia, down 2,943 TEUs (4.9%), and Taiwan, down 2,474 TEUs (4.4%). Overall, July's results point to a broad-based strengthening in import activity across major sourcing markets, led by China.
Figure 5: June 2026 to July 2026 Comparison of U.S. Import Volumes from Top 10 Countries of Origin
Source: Descartes Datamyne
Top 10 CoO imports decline year-over-year.
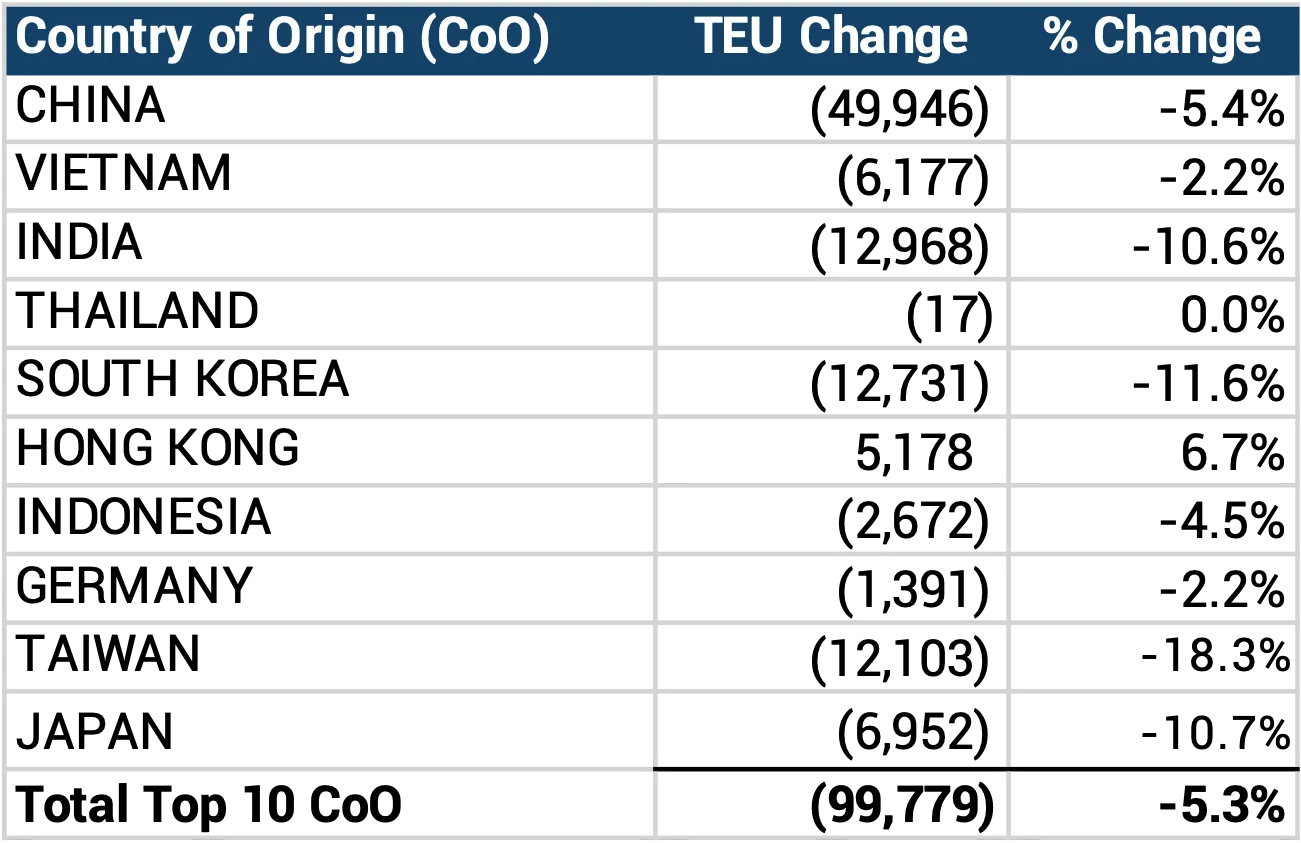
In July 2026, U.S. containerized imports from the top 10 CoO declined 5.3% year-over-year, representing a combined decrease of 99,779 TEUs (see Figure 6). China accounted for the largest volume decline, with imports falling 49,946 TEUs (5.4%) from July 2025. Other notable decreases included India, down 12,968 TEUs (10.6%), South Korea, down 12,731 TEUs (11.6%), Taiwan, down 12,103 TEUs (18.3%), and Japan, down 6,952 TEUs (10.7%). More modest declines were recorded for Vietnam, down 6,177 TEUs (2.2%), Indonesia, down 2,672 TEUs (4.5%), and Germany, down 1,391 TEUs (2.2%), while Thailand was essentially unchanged. Hong Kong was the only top 10 sourcing country to post a year-over-year increase, rising 5,178 TEUs (6.7%). Overall, July's results indicate that, despite stronger month-over-month activity, imports from most major sourcing markets remained below year-ago levels, with China accounting for roughly half of the total decline among the top 10 countries.
Figure 6: July 2025 to July 2026 Comparison of U.S. Import Volumes from Top 10 Countries of Origin
Source: Descartes Datamyne
West Coast ports continue to gain share in July.
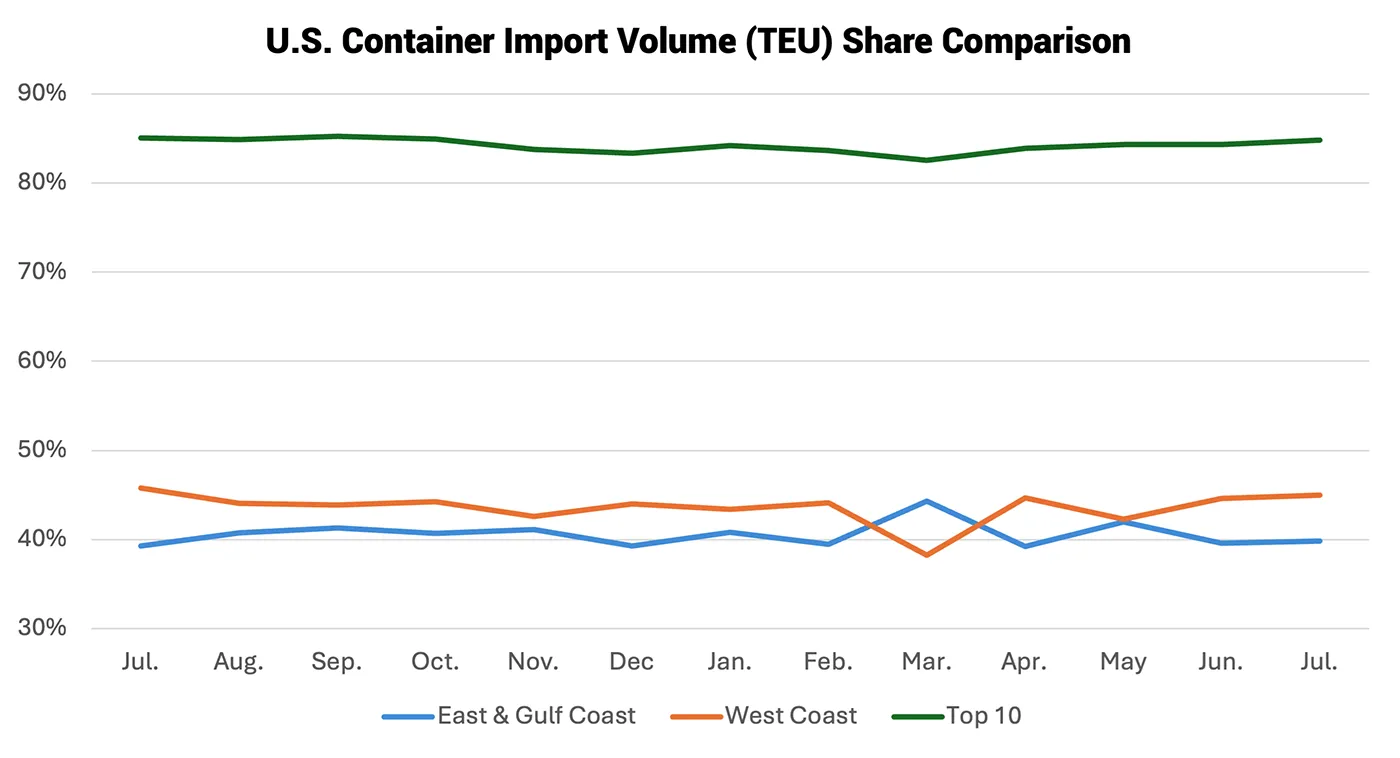
East and Gulf Coast ports accounted for 39.8% of total U.S. containerized imports in July 2026, up slightly from 39.6% in June, while West Coast ports increased their share to 45.0%, compared to 44.6% the previous month (see Figure 7). The top 10 U.S. ports handled 84.8% of total imports, up from 84.3% in June, a modest increase in cargo concentration among the nation's largest gateways. The results suggest that West Coast ports continued to strengthen their position in July, capturing a larger share of import activity as importers maintained a preference for Pacific gateways.
Figure 7: Volume Analysis for Top Ports, West Coast Ports and East and Gulf Coast Ports
Source: Descartes Datamyne™
Port delays increase across most major U.S. gateways in July.
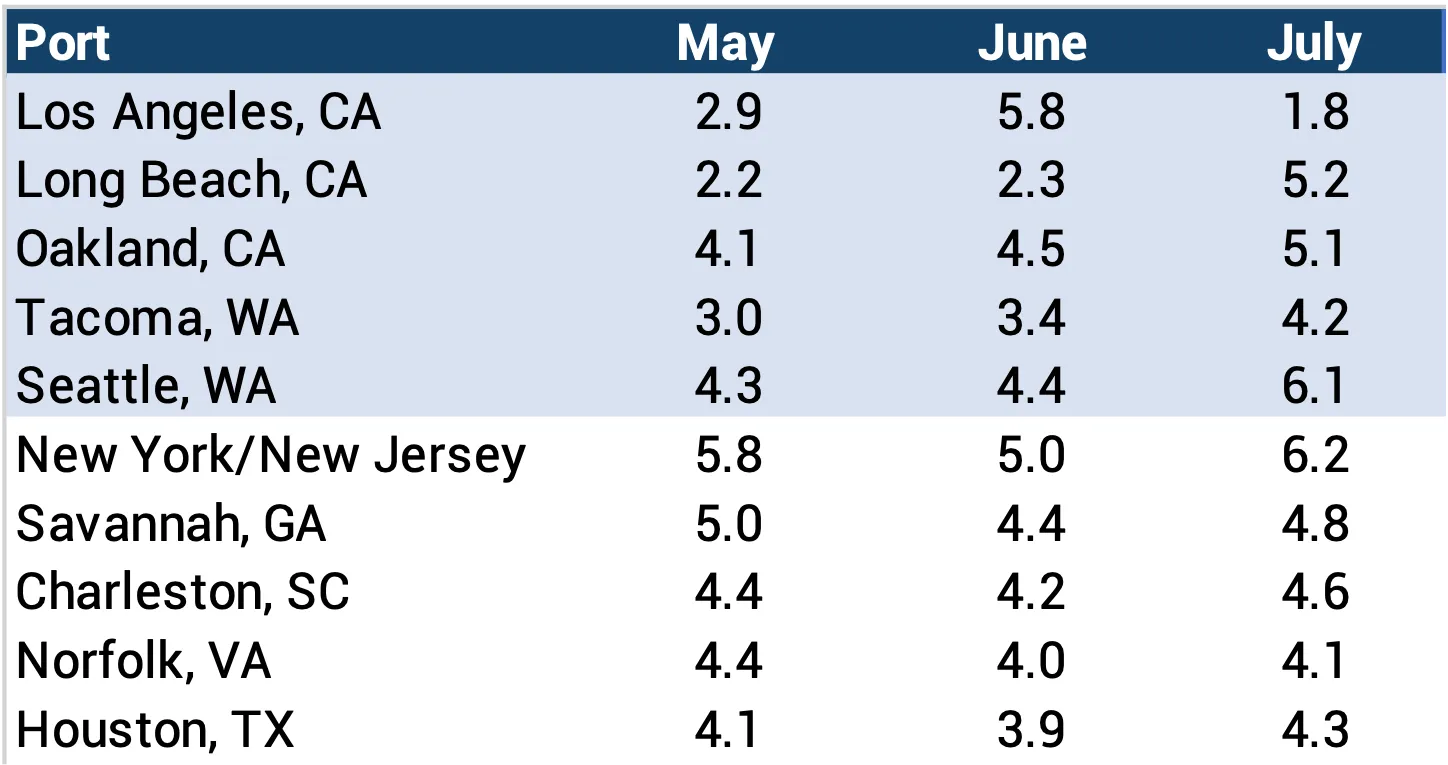
In July 2026, port transit delays increased across most major U.S. gateways (see Figure 8). The most significant change occurred at Long Beach, where delays increased by 3.0 days from 2.3 in June to 5.2 in July, the highest among the major ports included in the analysis. Additional increases in delays include Seattle by 1.7 days, Tacoma by 0.8 days, and Oakland by 0.6 days. Across the East and Gulf Coast, transit times also rose at New York (1.2 days), Savannah (0.4 days), Charleston (0.4 days), and Houston (0.4 days), while Norfolk increased by 0.1 days. On the West Coast, Los Angeles was the notable exception, with delays falling sharply from 5.8 days to 1.8 days. Overall, July transit times increased across most major U.S. gateways, in line with the heightened seasonal imports, while Los Angeles recorded a significant improvement.
Figure 8: Monthly Average Transit Delays (in days) for the Top 10 Ports (May – July 2026)
Source: Descartes Datamyne™
Note: Descartes’ definition of port transit delay is the difference as measured in days between the Estimated Arrival Date, which is initially declared on the bill of lading, and the date when Descartes receives the U.S. Customs and Border Protection (CBP) processed bill of lading data.
Gulf Coast imports rebound in July.
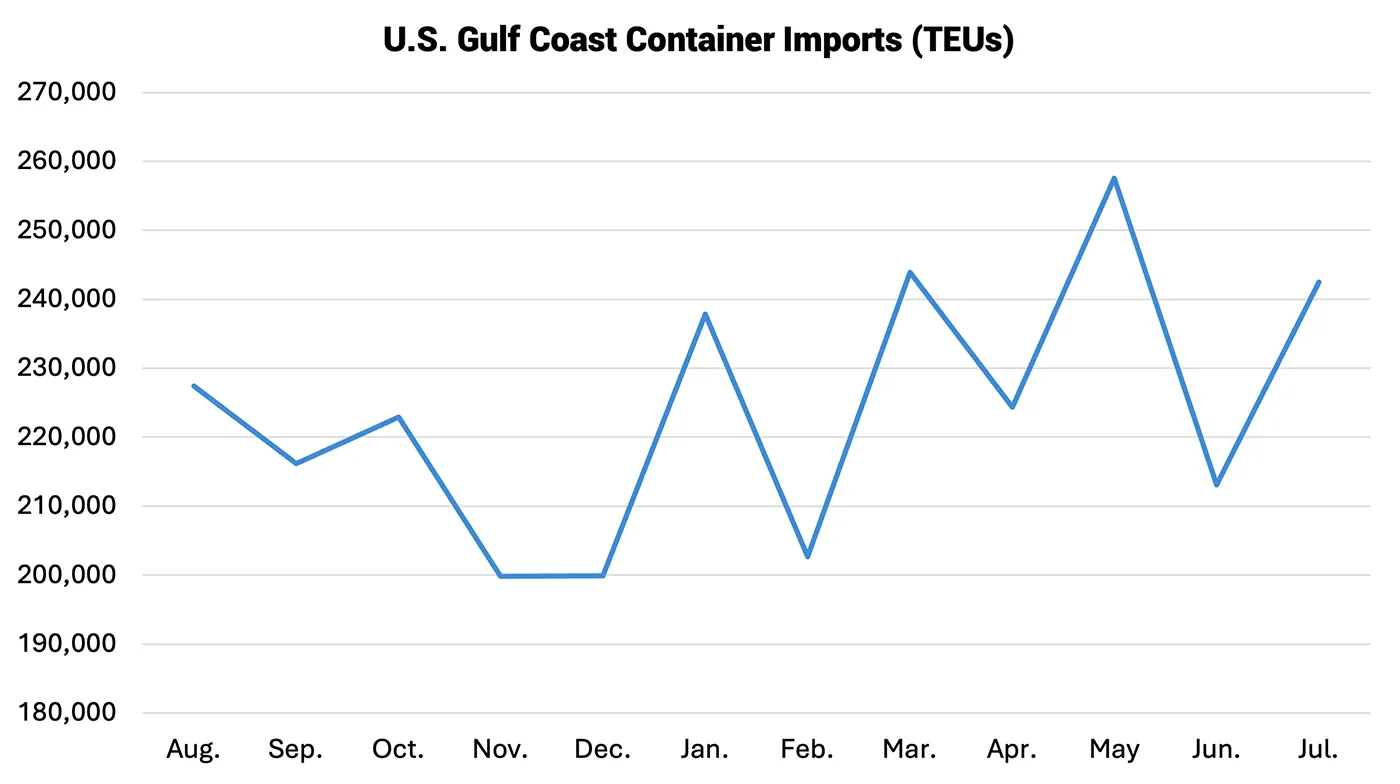
Gulf Coast container imports recovered in July 2026, totaling 242,507 TEUs, a 13.8% increase from June (see Figure 9). The gain reversed much of June's decline, lifting volumes 8.3% above the rolling 12-month average of 224,014 TEUs. While July remained below May's 2026 high of 257,564 TEUs, Gulf Coast import activity regained momentum after June's pullback, suggesting import demand remains resilient despite recent month-to-month volatility.
Figure 9: August 2025 to July 2026 U.S. Gulf Coast Container Imports
Source: Descartes Datamyne™
Trusted by




Global Shipping Report Archive
Stay informed with monthly shipping insights with the Global Shipping Report

Director, Industry Strategy, Global Trade Intelligence, Descartes

Subscribe to the Global Shipping Report
Stay informed with the latest shipping trends and U.S. container import logistics data every month with the Descartes Global Shipping Report
About Descartes Datamyne
Leverage the Power of Global Import and Export Trade Data
Optimize trade lanes, expand into new markets, discover alternative buyers and suppliers, as well as spot supply and demand shifts from a single integrated web-based platform to cost-effectively enhance your supply chain resilience and competitive edge.
Special Reports

2026 Top 30 U.S. Port Report
See how tariffs, routing choices, and sourcing strategies quietly reshaped the U.S. imports, and what those changes mean for 2026.
Download the 2026 Top 30 U.S. Port Report

A Year of Evolving U.S. Tariffs Reshapes Trade in Plastics
A surge in Transpacific plastic imports boosted U.S. port volumes in 2025, according to Descartes Datamyne™. Tariffs drove supply chain shifts for plastic goods, materials, and machinery.
Read the Report
An Analysis of U.S. Import Volumes Transiting Through the Strait of Hormuz
While the Strait of Hormuz accounts for a relatively small share of total U.S. maritime imports, the data shows that exposure is highly concentrated in critical commodities.
Read the Report
How Descartes Can Help
Descartes Datamyne delivers business intelligence with comprehensive, accurate, up-to-date, import and export information.
Our multinational trade data assets can be used to trace global supply chains and our bill-of-lading trade data – with cross-references to company profiles and customs information – can help businesses identify and qualify new sources. Ask us for a free, no obligation demonstration of our data on a product or trade commodity of your choosing – and keep the custom research we create with our compliments.